



ADC DAR Determination: LC-HRMS Strategies and Bioanalytical Challenges
-

Articles
-

Sep 04, 2026
Why is DAR Calculation Critical for ADC Pharmacokinetics?
Antibody-drug conjugate (ADC) has entered the stage of rapid and explosive growth in recent years. According to incomplete statistics, the number of ADC preclinical/clinical research and development (R&D) pipelines worldwide has also been accelerating annually (listed in Table 1).
Table 1. The Number of global preclinical/clinical development pipelines for ADCs from Year 2018 to 2025
Year | 2018 | 2019 | 2020 | 2021 | 2022 | 2023 | 2024 | 2025 |
Preclinical | 171 | 154 | 154 | 182 | 220 | 315 | 397 | 562 |
Phase I | 48 | 49 | 46 | 48 | 56 | 95 | 105 | 156 |
Phase II | 27 | 29 | 29 | 30 | 42 | 53 | 72 | 77 |
Phase III | 6 | 8 | 6 | 8 | 6 | 13 | 18 | 35 |
Different antibodies, ADC linkers, or payloads can affect the pharmacokinetic (PK) and toxicokinetic (TK) characteristics of ADCs. Even the distribution of conjugated ADC payloads within the same ADC may also lead to different PK and TK properties. Therefore, it is very important to evaluate ADC through the analysis of the distribution of DAR Values (Drug-to-Antibody Ratio, the average number of drug molecules conjugated to an antibody). This analysis, whether from a pharmacology, pharmacokinetics, or safety evaluation perspective, can help optimize ADCs to ensure the optimal therapeutic effect while minimizing potential adverse effects. It holds significant guidance for research and development, clinical trial design, and treatment plans of ADC drugs.
Determining ADC payload distribution and average DAR value requires consideration of several factors, including coupling method, ADC linker type, payload, and analysis scenario (synthesis characterization or pharmacokinetic analysis). The previous article has explained the methodology for DAR value analysis mainly using T-DM1 (Kadyla®), a representative lysine-conjugated ADC, as an example. Continuing from there, this article uses DS8201 (Trastuzumab deruxtecan, T-DXd, Enhertu®) as an example to highlight the differences in qualitative and semi-quantitative ADC DAR value detection methods between cysteine- and lysine-conjugated ADC. By analyzing the changes of DAR values of DS8201 in in vitro incubation system and in vivo plasma post-administration, the considerations, difficulties, and countermeasures for detecting the distribution and changes of ADC's DAR values in DMPK studies are explored in this article.
Common Conjugation Strategies for ADCs
ADCs are primarily differentiated by their conjugation sites, mainly including lysine-conjugated, cysteine-conjugated, genetically engineered unnatural amino acid conjugated, and N-glycosylated conjugated ADCs [1]. As the drug structures summarized in Table 2, among the marketed ADC drugs until 2023, in addition to Cetuximab sarotalocan for photoimmunotherapy and the fusion protein immunotoxin Lumoxiti, lysine-conjugated ADCs (four), exemplified by T-DM1 (Kadyla®), and cysteine-conjugated ADCs (nine), represented by DS8201 (Enhertu®), dominate the market. Cysteine-conjugated ADCs also include Seagen's series of drugs (Adcetris®, Padcev®, Polivy®, Tivdak®) based on the Vedotin platform with an MC linker and monomethyl auristatin E (MMAE) payload. Between 2019 and 2022, cysteine-conjugated ADCs accounted for 90% of the marketed ADC drugs.
Table 2. Summary of conjugation method of approved ADCs up to 2023
Trade name | Year Approved | Target | Antibody | Conjugation site | Payload | Linker |
Mylotarg | 2000/ September 2017 | CD33 | Gemtuzumab | Lysine | Calicheamicin | Hydrazone |
Adcetris | August 2011 | CD30 | Bentoximab | Cysteine | MMAE | MC-VC-pABC |
Kadcyla (T-DM1) | February 2013 | HER2 | Trastuzumab | Lysine | DM1 | Non-cleavable |
Besponsa | August 2017 | CD22 | Inotuzumab | Lysine | Calicheamicin | Hydrazone |
Lumoxiti | September 2018 | CD22 | Moxetumomab | Fusion protein | Pseudomonas Exotoxin A | NA |
Polivy | June 2019 | CD79β | Polatuzumab | Cysteine | MMAE | MC-VC-pABC |
Padcev | December 2019 | Nectin-4 | Enfortumab | Cysteine | MMAE | MC-VC-pABC |
Enhertu (T-Dxd, DS8201) | December 2019 | HER2 | Trastuzumab | Cysteine | Dxd | GGFG |
Trodelvy | April 2020 | Trop-2 | Sacituzumab | Cysteine | SN38 | CL2A |
Blenrep | August 2020 | BCMA | Belantamab | Cysteine | MMAF | MC-VV |
Lonca | April 2021 | CD19 | Loncastuximab | Cysteine | PBD | MC-PEG-VA-pABC |
Vedecituximab | June 2021 | HER2 | Disitmab | Cysteine | MMAE | MC-VC-pABC |
Tivdak | September 2021 | TF | Tisotumab | Cysteine | MMAE | MC-VC-pABC |
Elahere | November 2022 | FRα | Mirvetuximab | Lysine | DM4 | Di-sulfide bond |
Structural Characteristics of Cysteine-Conjugated ADCs
IgG1-typed antibody has four pairs of inter-chain disulfide bonds composed of cysteine residues, which could be chemically reduced to yield eight free thiol groups. These free thiol groups can undergo a conjugation process with ADC linker-payload via the sulfhydryl groups located through a chemical reaction with the linker (e.g., Michael addition reaction with a nucleophilic reaction substrate such as maleimide), and this can be considered as a form of site-specific conjugation. Figure 1 shows that an ADC with a maximum conjugated number, DAR8, can be obtained when saturated conjugation is used. The following discussion provides a deep understanding of cysteine-conjugated ADC drugs through examining the structure of the classical drug DS8201 (Figure 2).
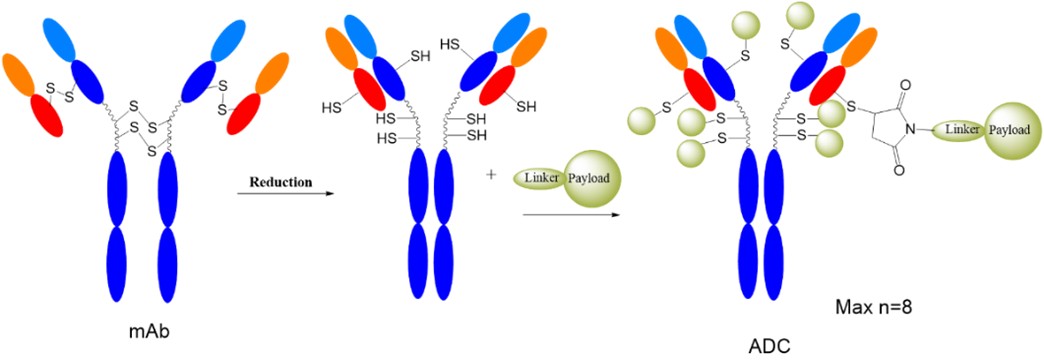
Figure 1. Structural representation of cysteine-conjugated ADC
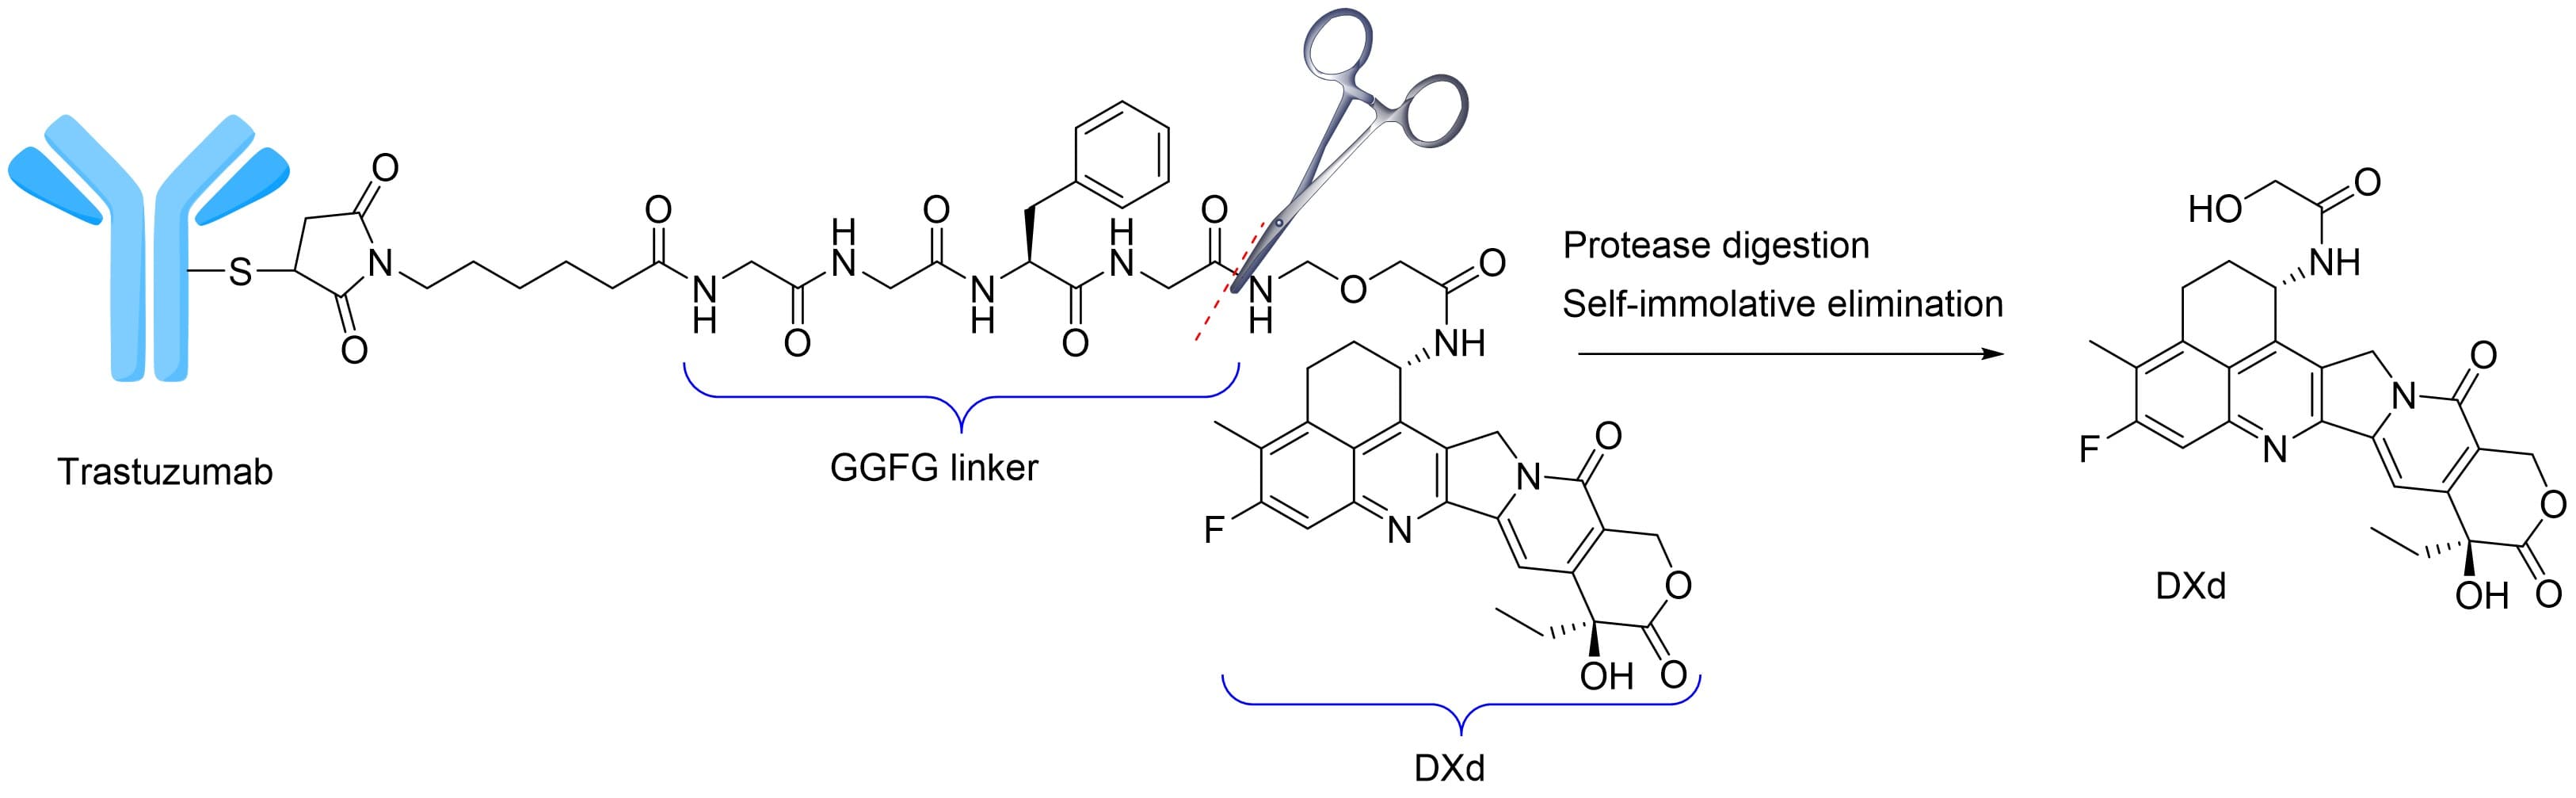
Figure 2. Structure diagram and release mechanism of DS8201
DS8201 uses trastuzumab as the antibody, a camptothecin analogue DXd as the ADC payload, and an enzymolysis-cleavable GGFG tetrapeptide as the linker [2]. The conjugation of the antibody to the drug is achieved through the addition of the thiol group on a monoclonal antibody to the maleimide group on the linker, resulting in an average DAR of 7-8. The linker optimization of DS8201 can improve its enzymatic hydrolysis stability to reduce the untargeted ADC payload release; it can also avoid physicochemical property disadvantages such as hydrophobic payload aggregation at high DAR values [3]. This allows maximized benefits of payload release quantity and site-directed conjugation uniformity.
The success of DS8201 brings more confidence in cysteine site-specific conjugation techniques for ADC development. According to public information [4-7], other ADCs have been developed in different clinical stages, such as Patritumab deruxtecan (U3-1402) [4] developed by Daiichi Sankyo targeting HER3,7 and SGN-CD228A [5] developed by Seagen. Patritumab deruxtecan (U3-1402) uses the same GGFG linker and DXd payload as DS8201, and SGN-CD228A uses glucuronic acid as the linker and MMAE as the payload. In China, among cysteine site-specific conjugate ADCs, SHR-A1811 [6] developed by Hengrui has already been marketed, while 23C2 HER2-2-DDDXD [7] developed by Chia Tai Tianqing are under development.
Application of High-Resolution Mass Spectrometry (HRMS) in the Detection of DAR Values of ADC Drugs in Biological Samples
High-resolution mass spectrometry (HRMS) is an effective technique for determining the ADC DAR values. Immunocapture enrichment is required before detecting the DAR values of ADC in biological samples (e.g., serum/plasma) by HRMS. As shown in Figure 3, the immunocapture method usually uses a streptavidin-modified carrier (such as magnetic beads or extraction columns) to form a complex with biotin-labeled capture protein, which binds to the ADC analyte in the samples for an antigen-antibody reaction and retains it on the carrier. After discarding the solution, the carrier is eluted to obtain purified ADC and antibody protein.
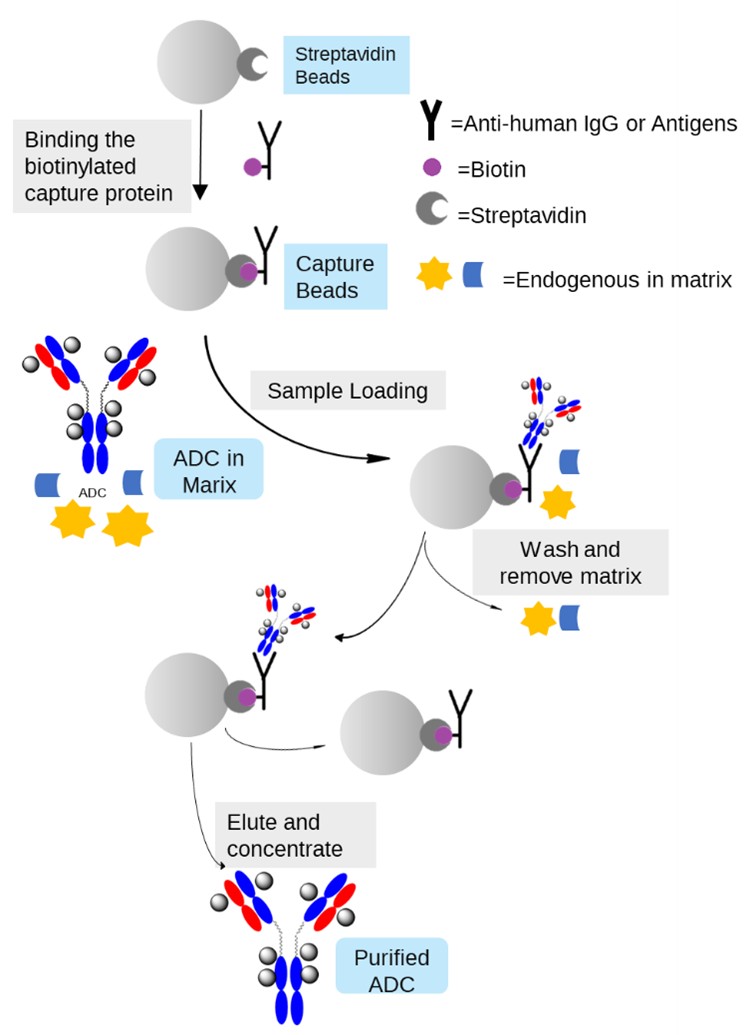
Figure 3. Method Workflow of Immunocapture of ADC in Biological Samples by Magnetic Beads
ADCs with different DAR values have distinct molecular weights. The intact protein or protein subunits (light chain/heavy chain) can be separated by liquid chromatography and detected by HRMS. The mass-charge ratio (m/z) of each component in the samples can be obtained. As shown in Figure 4, the proteins with different numbers of charges present the distribution of the valence-mass charge ratio in the mass spectrum. The deconvoluted mass spectrum of different components needs to be converted by software processing (shown in Figure 5). The ADC DAR values of different components are characterized according to the mass to obtain the DAR value distribution information of ADC drugs, and then the average DAR value can be calculated by normalization according to the mass spectrometry intensity of components with different ADC DAR values.
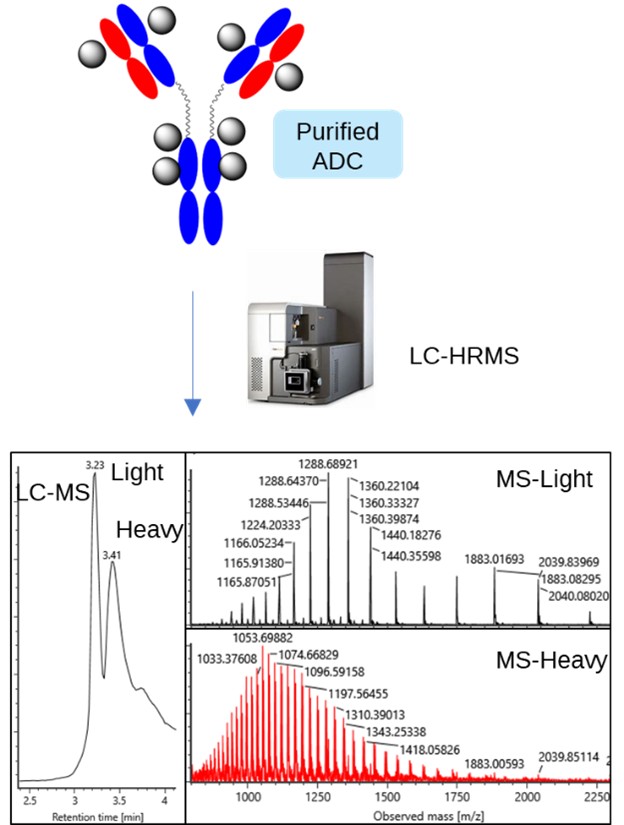
Figure 4. LC-MS Profiles and Mass Spectra of ADC by Liquid Chromatography-High Resolution Mass Spectrometry (LC-HRMS)
As shown in Figure 5A, for lysine-conjugated ADCs, the molecular weight of the intact protein is usually directly detected, while the mass of light chain/heavy chain substructures is analyzed to obtain DAR values for cysteine-conjugated ADCs (depicted in Figure 5B).
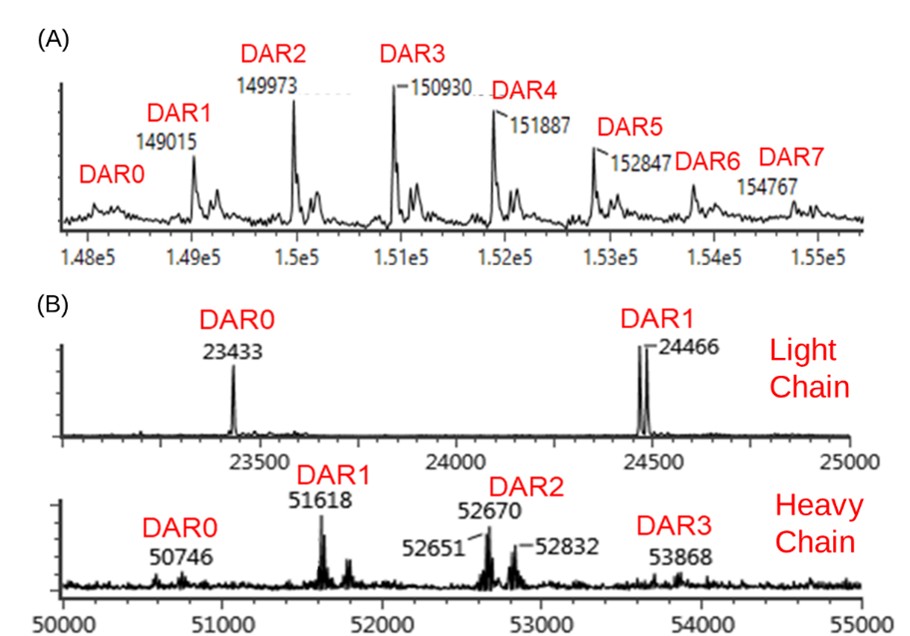
Figure 5. Deconvoluted Mass Spectrum and DAR Value Distribution of ADC (A: Intact Protein Mass of the Lysine-Conjugated ADC; B: Mass of the Light Chain/Heavy Chain Substructure of the Cysteine-Conjugated ADC)
When all inter-chain disulfide bonds are reduced and conjugated (DAR8), the antibodies of cysteine-conjugated ADCs will present a dissociation state where two light chains and two heavy chains will appear in the reverse phase chromatography of the acidic mobile phase due to the absence of inter-chain disulfide bonds (shown in Figure 6A). What can be detected in the HRMS is the light chain conjugated with one payload (L1) and the heavy chain conjugated with three payloads (H3).
When incomplete conjugation is used for synthesis (such as DAR4), only part of the disulfide bonds is reduced to thiols and conjugated, and there may be various inter-chain disulfide bond combination morphologies such as light-heavy chain, heavy-heavy chain, and light-heavy-heavy chain. This leads to complex mass spectrometry peaks, complicating the ADC DAR calculation, and even hindering the calculation of the accurate DAR values. On the other hand, even in the complete conjugation mode, the ADC with a high DAR value may still have linker deconjugation, then the exposed thiols may form oxidized inter-chain disulfide bonds, which complicates the calculation of the ADC DAR value.
For the inter-chain disulfide bond combination in these cases, the reduction step can be used post-immunocapture to ensure the inter-chain disulfide bonds are opened (demonstrated in Figure 6B). The test objects are degenerated into two forms of DAR = 1 (L1) and DAR = 0 (L0) for the light chain and four forms of DAR = 3 (H3), DAR = 2 (H2), DAR = 1 (H1) and DAR = 0 (H0) for the heavy chain. After obtaining the mass spectrometric intensities of the light chains and heavy chains, the overall average DAR value of the ADC can be obtained.
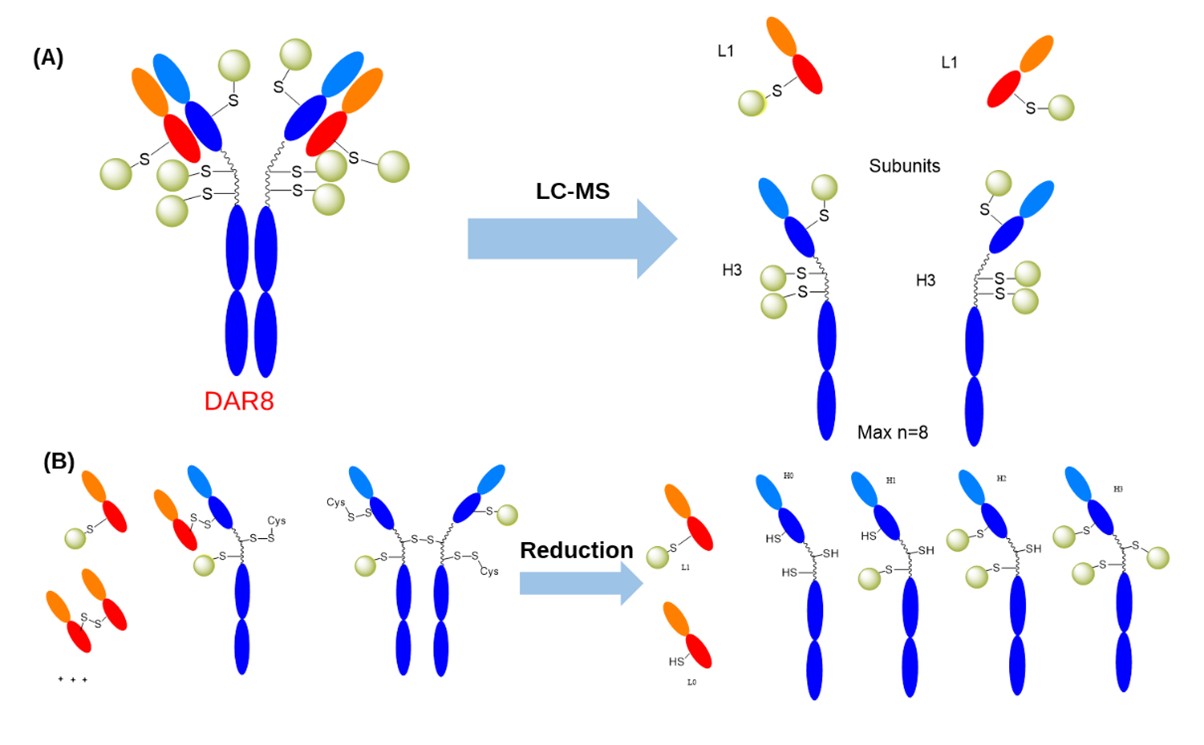
Figure 6. Schematic of Cysteine-conjugated ADC melting in chromatography (A) and reduction pretreatment (B)
For non-site-specific lysine-conjugated ADCs, the conjugation sites include 80–90 lysine residues distributed on the antibody without changes in inter-chain disulfide bonds. If the disulfide bonds of these ADCs are also reduced, the distribution of DAR values of their light and heavy chains will be more complex, and the difficulty of data processing will increase, so the non-reduced intact proteins will be selected as analyte in this case.
Case Study: Analysis of ADC DAR Values for DS8201
As shown in Figure 7, according to the results from the monkey in vivo PK study of DS8201 reported in the literature [8], the half-life of total antibody and total ADC was about 4 days, and the plasma concentrations decreased from about 100 μg/mL to below 10 μg/mL within 0~14 days. From a DMPK perspective, the incubation conditions of in vitro plasma stability experiments can be set up according to the Cmax (100-200 μg/mL) of in vivo studies after administration; while for the detection of ADC DAR values of in vivo samples from animals and clinical trials (the clinical administration dose of DS8201 is 5.4 mg/kg), the limit of detection nearly at the1 μg/mL level needs to be met, making the ADC bioanalysis more challenging.
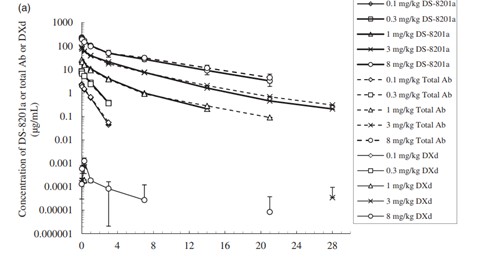
Figure 7. In vivo pharmacokinetics data after injection of DS-8201 in monkeys (dosage of 0.1-8 mg/kg; ━: total ADC;---: total antibody; ─: payload DXd) [8]
Referring to the literature data, we performed in vivo pharmacokinetic experiments in SD rats at a dose of 3 mg/kg of DS8201 (T-DXd) and performed in vitro stability studies in rat plasma at an incubation concentration of 100 μg/mL of DS8201 (T-DXd). The obtained in vitro and in vivo plasma samples were subjected to acid elution after affinity immunocapture, followed by neutralization and treatment with a reducing agent. The final processed samples were detected by Waters Acquity I-Class liquid chromatogram tandem Waters Vion Q-Tof mass spectrometry and the data was processed using Waters Unifi software.
Figure 8 shows the deconvoluted mass spectra of T-DXd in plasma samples at different time points through the above analysis process. The molecular weight of the linker-payload of T-DXd was 1034. Figure 2.26 (A-1) and (B-1) show the mass of the 0-payload light chain (L0) and 1-payload light chain (L1 = L0 + 1034 Da). As the plasma incubation time increases, the signal of L0 gradually rises as the signal of L1 decreases, which represents that the light chain loses the mass of an intact linker-payload, that is, the reverse-Michael elimination reaction occurs. At the same time, the light chain gradually generates a peak of L1 + 18 Da, which represents the hydrolytic ring opening of succinimide according to the structure and mechanism of the ADC linker, and this hydrolytic ring opening will competitively inhibit the decoupling reaction of reverse-Michael elimination. Since no other mass was detected between L0 and L1, no cleavage of the ADC linker-payload occurred except for the loss of intact linker-payload, reflecting the high stability of the tetrapeptide linker design of T-DXd and the payload DXd.
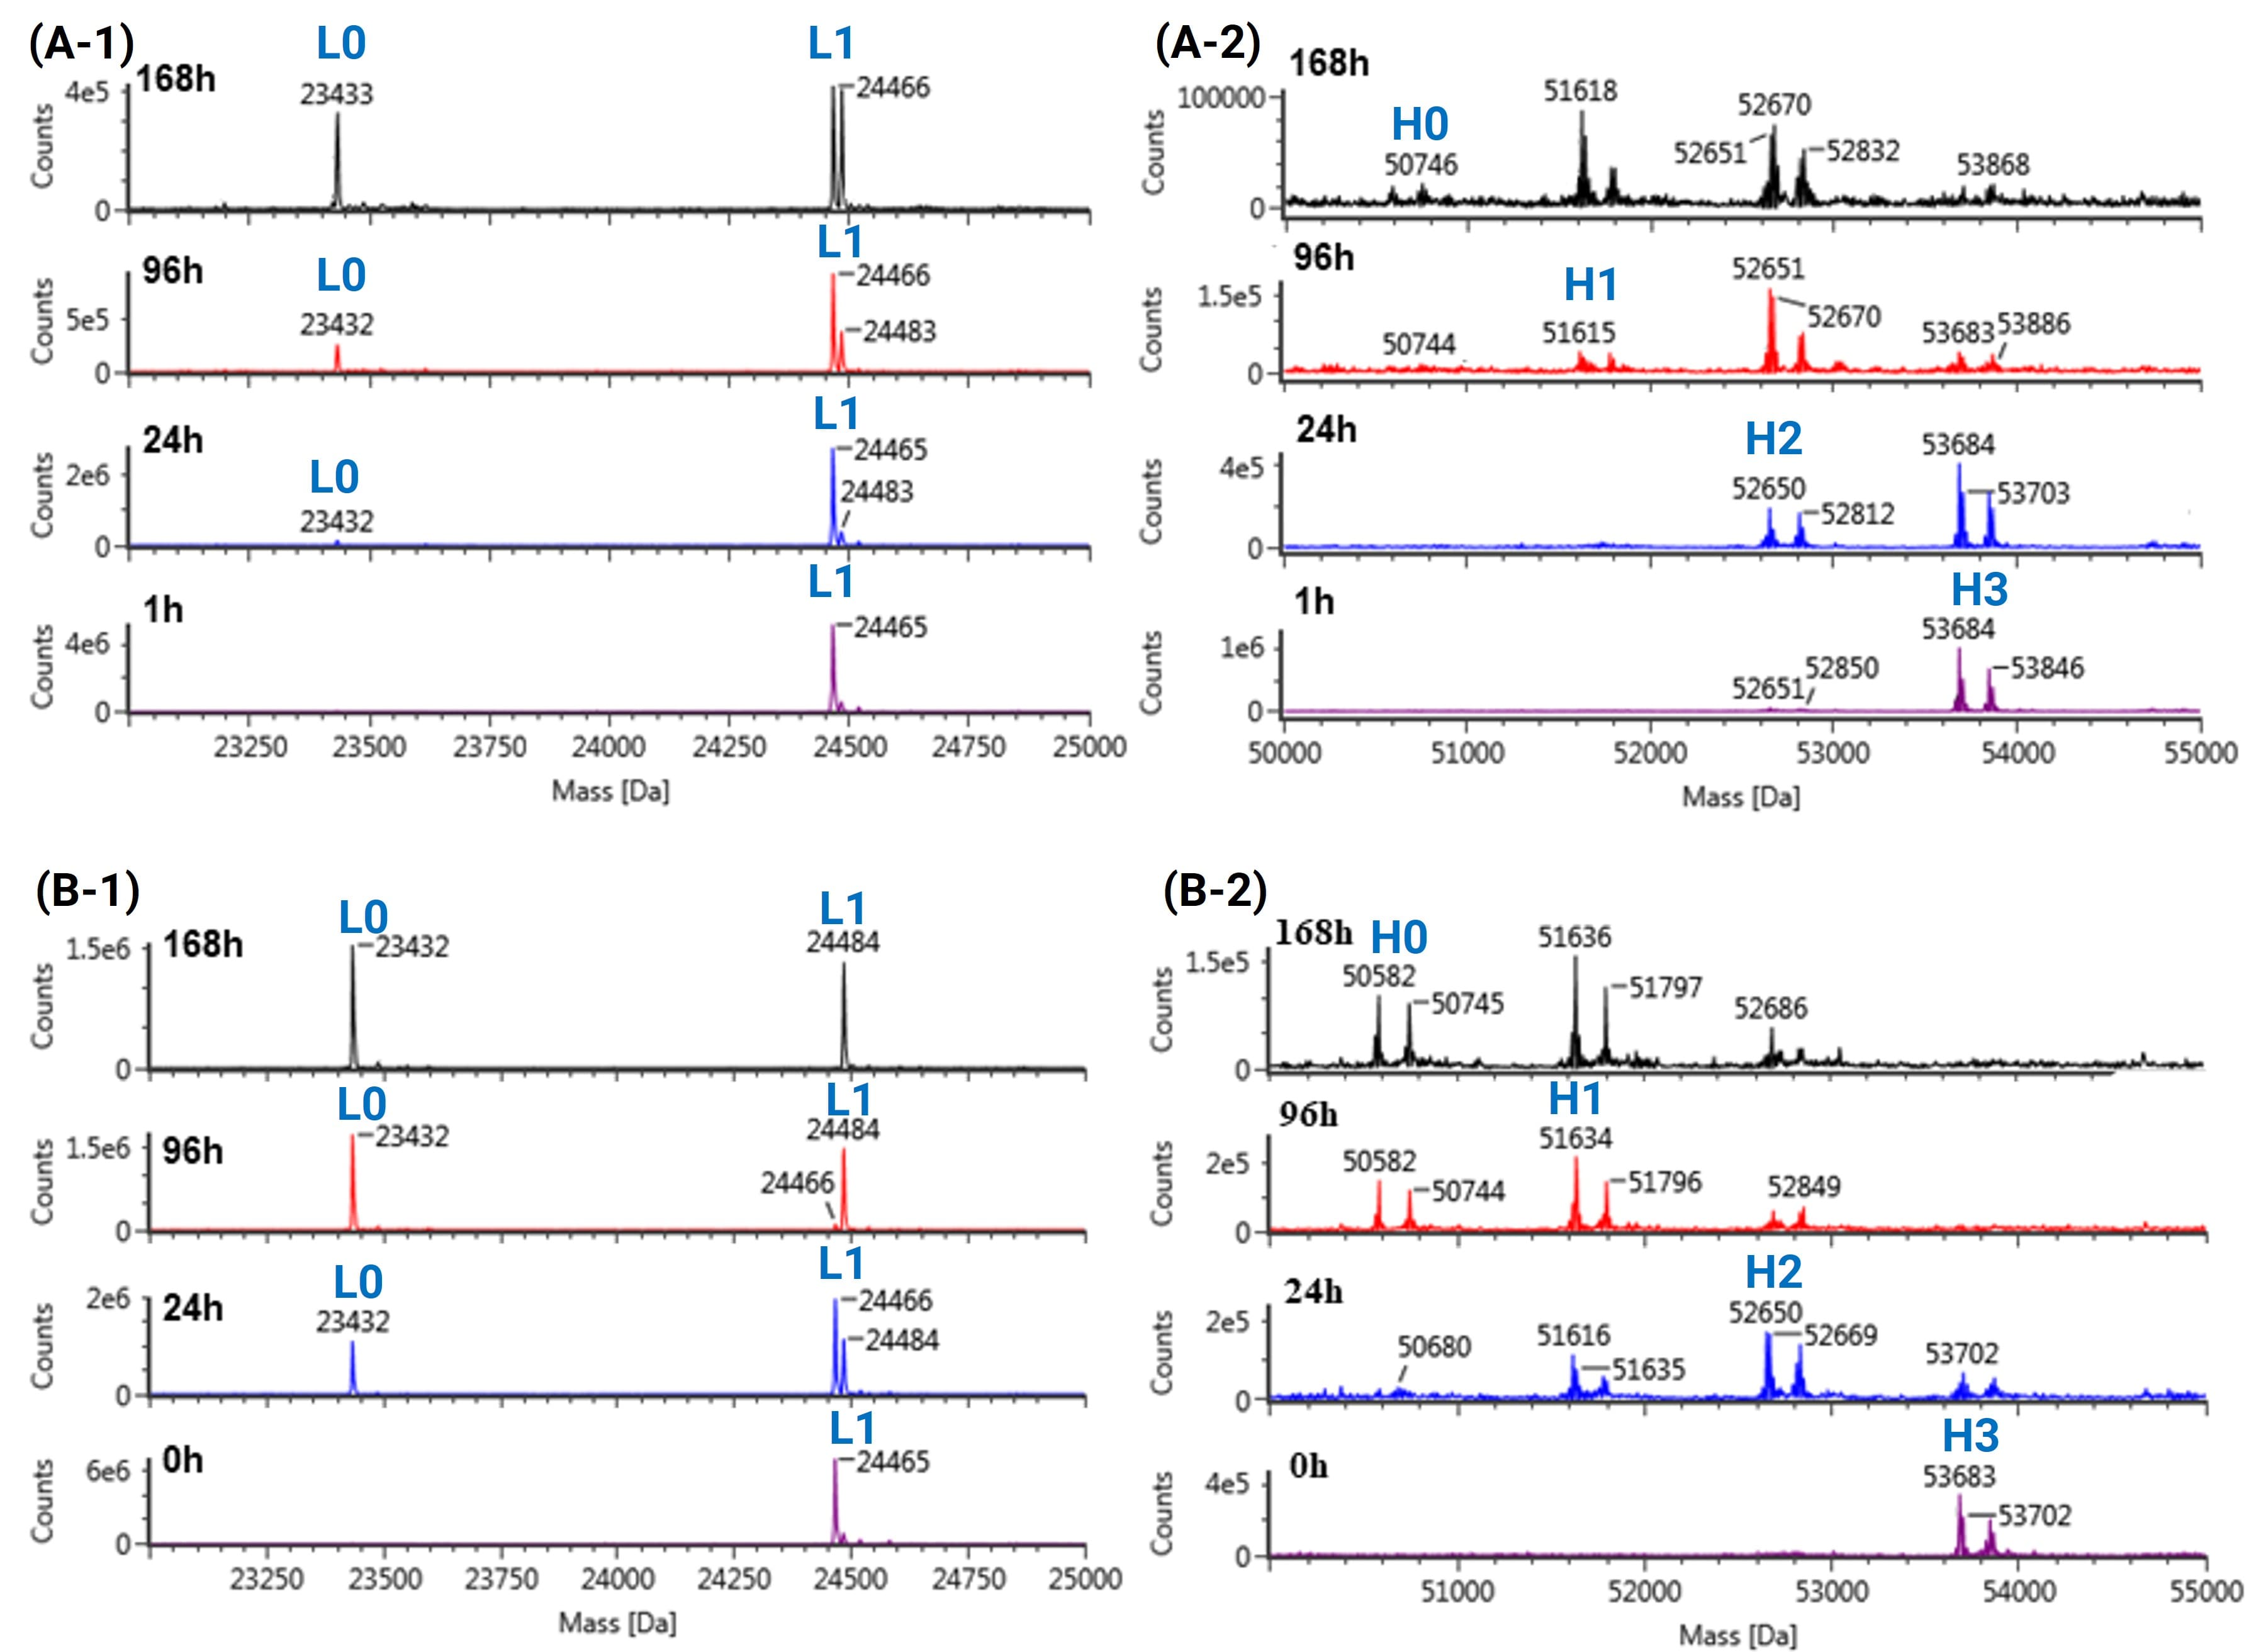
Figure 8. Deconvoluted mass spectra of T-DXd in plasma samples (0, 24, 96, and 168 hours after incubation in vitro; 1, 24, 96, and 168 hours after administration in vivo)
(A-1: in vivo light chain; A-2: in vivo heavy chain; B-1: in vitro light chain; B-2: in vitro heavy chain)
For the heavy chains shown in Figure 8 (A-2) and (B-2), the mass species distribution in the mass spectrum is much more complex than that of the light chain. The mass spectrum shows that in addition to the main peak H3 (Heavy Chain containing three payloads), there is a mass peak with a difference of 162 Da, representing the different glycoform distribution on the heavy chain inherited from the monoclonal antibody. With the extension of incubation time, when the entire linker-payload deconjugation occurs, the 2-payload heavy chain (H2), the 1-payload heavy chain (H1), and the 0-payload heavy chain(H0) are gradually produced with corresponding glycoform peaks. In addition, the succinimide of each ADC linker can undergo hydrolytic ring opening, and then the heavy chain Hn (n = 1, 2, 3) can undergo n + 18 Da mass changes in addition to the number of removed masses of 1034 Da. When calculating the DAR values, each species with different degrees of hydrolysis needs to be counted because the degree of hydrolysis is dynamically changed, and the degree of hydrolysis varies for mass species with different ADC DAR values.
Difficulties and Countermeasures in ADC DAR Calculation by LC-HRMS
Due to the conjugation with the ADC linker and payload, there are some differences in the structure and properties between ADC and monoclonal antibody. Some challenges will be encountered in ADC DAR value detection by LC-HRMS. The following contents discuss two main difficulties and provide possible countermeasures:
Immunocapture efficiency
When the steric hindrance of the ADC payload is significant, the conjugated ADC may not be easy to form immune binding compared with the monoclonal antibody. To obtain better immune capture efficiency, it is critical to select the appropriate capture reagent. Immunocapture usually targets the Fc region of the antibody, using anti-human Fc antibody capture, or targets the variable region using antigen protein capture. Since ADCs usually use human-derived IgG-based antibodies, when the matrix is human plasma, various human-derived IgGs dominate the matrix, and extraction with anti-Fc antibody protein lacks selectivity. At this time, only target antigen protein can be used for capture, with a relatively high cost; while in the animal matrices, the anti-Fc antibody is usually used to obtain good extraction selectivity, but when the capture efficiency is low or the matrix interference is large, it may still be necessary to consider the use of target antigen protein as the capture reagent to enhance the selectivity and improve the extraction efficiency.
Optimization of extraction recovery by immunocapture can also be achieved by adjusting the ratio between solid-phase – capture protein – plasma samples. The loading volume of the plasma sample is evaluated according to the in vitro incubation concentration, in vivo administration dosage, and the limit of detection of the instrument. The amount of capture protein is slightly excessive depending on the estimated drug concentration, and saturation of the surface site of the solid phase needs to be considered to reduce sample loss due to non-specific adsorption or excessive matrix impurity residue.
Mass spectrometry response for different ADC DAR values
When the polarity and charge distribution of the ADC payload cause different ionization efficiency for different DAR values, it may cause different response factors in mass spectrometry for ADCs with different DAR values (shown in Figure 9), resulting in the change degree of ADC DAR value being overestimated or underestimated. In this case, the correction curve of response intensity can be obtained by proportionally mixing the naked antibody and the sample with the maximum ADC DAR values. The coefficient of relative response/relative concentration of the species with a high ADC DAR value relative to the fragment with a low DAR value can be calculated, and then the weight coefficient can be added when calculating the DAR value. When the ADC payload not only affects the capture efficiency but also inhibits the mass spectrometry response, the response sensitivity of the components with high DAR value will be severely limited, especially considering that the heavy chain will simultaneously superimpose the effects of glycoform distribution, DAR distribution and hydrolysis peak distribution, and its signal will be significantly lower than that of the light chain. These issues need to be taken into full consideration for the prediction of effective test concentrations, and deglycosylation operations can be performed as well as mass spectrometric detection modes and ionization parameters can be adjusted during method development. If the effective signal-to-noise ratio cannot be obtained, the effective qualitative and semi-quantitative analysis of ADC DAR values cannot be performed for the samples of the pharmacokinetic experiments.
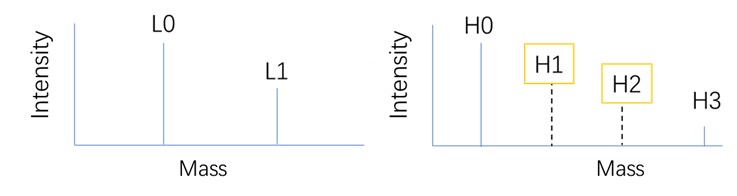
Figure 9. Schematic intensity of different DAR species of antibody in the mass spectrum [11]
Conclusion: Advancing ADC Bioanalysis and ADC Pharmacokinetics
With the continuous development of ADC technology, engineered cysteine conjugation technology has been developed. These methods mutate the specific antibody sites into cysteine, allowing the generation of the cysteine-conjugated ADC with determined conjugation position and DAR without opening the inter-chain disulfide bond, such as the Thiomab technology developed by Genentech [9]. In addition, there are ways to prevent the retro-Michael elimination reaction by hydrolytic ring-opening pretreatment to the maleimide or other covalent binding methods that resist decoupling, such as SKB264/BT001035 developed by Cullgen Therapeutics [10], which uses a methanesulfonylpyrimidine-thiol coupling method, to minimize decoupling.
For the mass spectrometry analysis technology of antibodies, researchers are also continuously developing, adjusting, and optimizing to better meet specific needs, such as microfluidic and capillary electrophoresis-based separation, native analysis, and other methods.
From the macromolecular protein perspective, biotransformation can be qualitatively measured, and ADC DAR value changes can be calculated based on molecular weight. Combined with the metabolite identification of payload-related small molecule compounds released from ADCs, this can help comprehensively evaluate the biotransformation of ADCs.
Arthurs: Liqi Shi, Weiqun Cao
Talk to a WuXi AppTec expert today to get the support you need to achieve your drug development goals.
Committed to accelerating drug discovery and development, we offer a full range of discovery screening, preclinical development, clinical drug metabolism, and pharmacokinetic (DMPK) platforms and services. With research facilities in the United States (New Jersey) and China (Shanghai, Suzhou, Nanjing, and Nantong), 1,300+ scientists, and over fifteen years of experience in Investigational New Drug (IND) application, our DMPK team at WuXi AppTec are serving 1,700+ global clients, and have successfully supported 2,100+ IND applications.
Reference
[1] Fu, Z., Li, S., Han, S., et.al. (2022). Antibody-drug conjugate: the “biological missile” for targeted cancer therapy. Signal transduction and targeted therapy, 7(1), 93.
[2] Nakada, T., Sugihara, K., Jikoh, T., et.al. (2019). The latest research and development into the antibody–drug conjugate,[fam-] trastuzumab deruxtecan (DS-8201a), for HER2 cancer therapy. Chemical and Pharmaceutical Bulletin, 67(3), 173-185.
[3] Ross, P. L., & Wolfe, J. L. (2016). Physical and chemical stability of antibody drug conjugates: current status. Journal of pharmaceutical sciences, 105(2), 391-397.
[4] Hashimoto, Y., Koyama, K., Kamai, Y., et.al. (2019). A novel HER3-targeting antibody–drug conjugate, U3-1402, exhibits potent therapeutic efficacy through the delivery of cytotoxic payload by efficient internalization. Clinical Cancer Research, 25(23), 7151-7161.
[5] Patnaik, A., Meric-Bernstam, F., Rocha Lima, C. M. S. P., et.al. (2020). SGN228-001: A phase I open-label dose-escalation, and expansion study of SGN-CD228A in select advanced solid tumors.
[6] Zhang, T., Xu, J., Yin, J., et.al. (2023). SHR-A1811, a novel anti-HER2 antibody–drug conjugate with optimal drug-to-antibody ratio, superior bystander killing effect and favorable safety profiles.
[7] X, Zhang, WO2022033578, Antibody drug conjugate
[8] Nagai, Y., Oitate, M., Shiozawa, H., et.al. (2019). Comprehensive preclinical pharmacokinetic evaluations of trastuzumab deruxtecan (DS-8201a), a HER2-targeting antibody-drug conjugate, in cynomolgus monkeys. Xenobiotica.
[9] Sadowsky, J. D., Pillow, T. H., Chen, J., et.al. (2017). Development of efficient chemistry to generate site-specific disulfide-linked protein–and peptide–payload conjugates: application to THIOMAB antibody–drug conjugates. Bioconjugate chemistry, 28(8), 2086-2098.
[10] Cheng, Y., Yuan, X., Tian, Q., et.al. (2022). Preclinical profiles of SKB264, a novel anti-TROP2 antibody conjugated to topoisomerase inhibitor, demonstrated promising antitumor efficacy compared to IMMU-132. Frontiers in Oncology, 12, 951589.
[11] Liang Shen, editor. Drug Metabolism and Pharmacokinetics: Frontiers, Strategies, and Applications. Wiley. 2025. http://doi.org/10.1002/9781394300150.


Related Services and Platforms


-
 DMPK BioanalysisLearn More
-
Novel Drug Modalities DMPK Enabling PlatformsLearn More
-
Novel Drug Modalities BioanalysisLearn More
-
Small Molecules BioanalysisLearn More
-
Bioanalytical Instrument PlatformLearn More
-
PROTAC DMPK ServicesLearn More
-
ADC DMPK ServicesLearn More
-
Antibody-Oligonucleotide Conjugate (AOC) DMPK ServicesLearn More
-
Oligo DMPK ServicesLearn More
-
PDC DMPK ServicesLearn More
-
Peptide DMPK ServicesLearn More
-
mRNA DMPK ServicesLearn More
-
Covalent Drugs DMPK ServicesLearn More
Stay Connected
Keep up with the latest news and insights.

