



Integrated mRNA Bioanalysis in DMPK Studies: Platforms for LNP-mRNA Therapeutics
-

Articles
-

Nov 21, 2026
Introduction to DMPK Studies for mRNA Therapeutics
DMPK studies of mRNA drugs fall into two categories: mRNA vaccines and mRNA therapeutics. mRNA vaccine research mainly focuses on mRNA tissue distribution and novel carrier excipients. In contrast, research on mRNA therapeutics must encompass the proteins expressed post-administration, any associated immunogenicity, and pharmacokinetics/pharmacodynamics (PK/PD) studies. To offer the necessary bioanalytical support for these diverse DMPK studies and topics, we have developed a set of integrated bioanalytical platforms specifically for mRNA drugs. For mRNA drugs encapsulated in representative lipid nanoparticles (LNPs), this includes the analysis of the mRNA itself, expressed proteins, novel carrier excipients (cationic lipid or PEG lipid), immunogenicity, and biomarkers. Below, we will detail the specific bioanalytical content of each type of component, as well as the corresponding internal validation experiments.
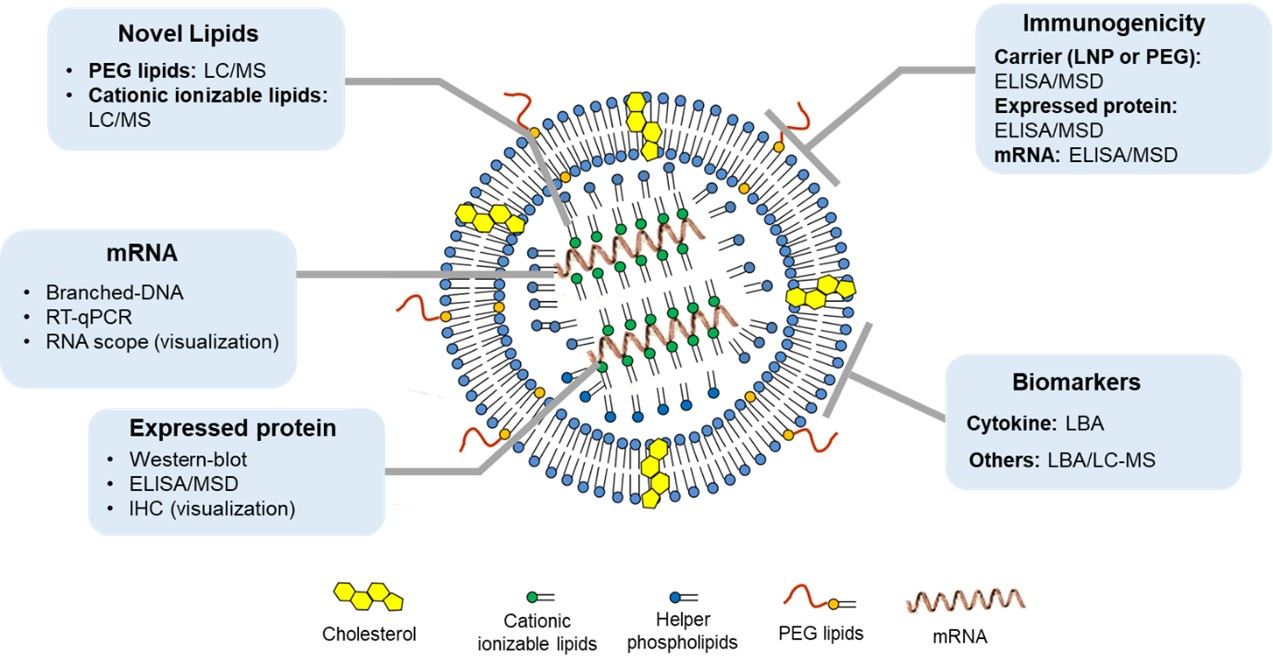
Figure 1. Integrated bioanalysis content and corresponding bioanalysis platforms for mRNA drugs (once again with LNP-mRNA drugs)
Contents and Platforms of Integrated mRNA Bioanalysis
RT-qPCR Platforms for mRNA Bioanalysis
mRNA bioanalysis is mainly performed using two types of platforms, one based on polymerase chain reaction (PCR) and the other based on the signal amplification reaction (mimic ligand-binding assay), respectively. As shown in Figure 2, for the basic principle, mRNA is reverse transcribed into cDNA and then is further subjected to amplification by a polymerase. The mRNA increment in the RT-qPCR reaction is monitored via the fluorescence of SYBR Green or a probe (e.g., the TaqMan method). The absolute amount of mRNA is indicated by Ct values, which are defined by the number of cycles required to reach a specific threshold (a certain fluorescence intensity). As for the signal amplification reaction, branched-DNA (b-DNA) relies on nucleic acid probes of complementary sequences to capture mRNA on a solid-phase carrier; then multiplex probes are incorporated to precisely amplify the signal in a step-by-step manner. Eventually, the enzymes linked to the probes react with the specific substrates, generating a signal that is proportional to the absolute amount of mRNA.
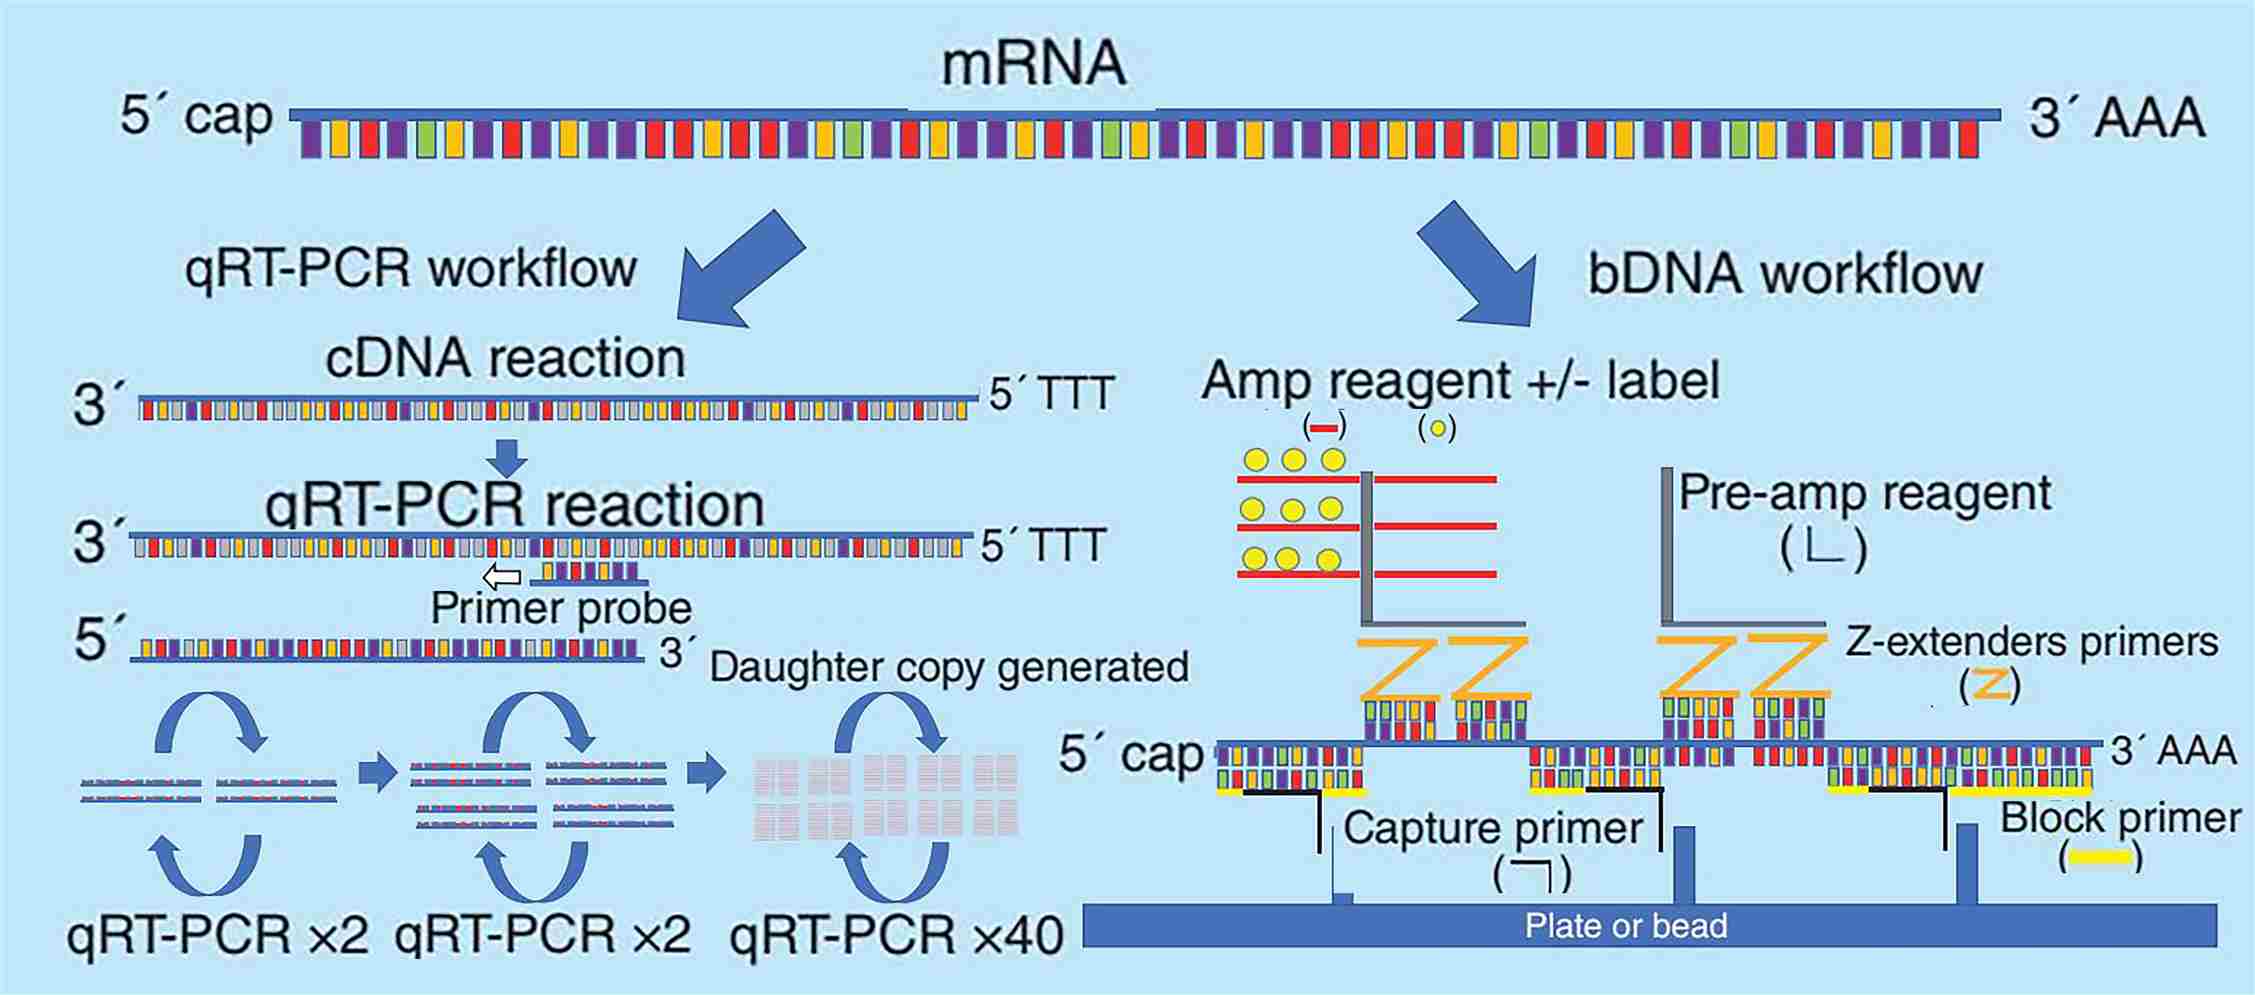
Figure 2. Schematic diagram of the basic principles of RT-qPCR and b-DNA for mRNA analysis[1]
Notably, RNA-scope microimaging analysis is another popular platform, in addition to the two absolute quantification-based analytic systems mentioned above. Despite it being a semi-quantitation technique, its excellent visualization for delivering finer space of mRNA and other information for cellular structures still attracted many early mRNA researchers. For example, Moderna employed it to investigate the tissue distribution of the mRNA-LNP vaccine. The RNA-scope technology is similar to b-DNA in principle since it is likewise based on nucleic acid probe hybridization and signal amplification.
The RT-qPCR platform is primarily used in the mRNA bioanalysis of drugs, especially for IND approval. However, the regulatory guidelines are still lagging. Thus, we developed our own RT-qPCR method and acceptance criteria for validation based on industry white papers as well as the Global CRO Council (GCC)[2]. Method validation includes but is not limited to the standard curve, sensitivity, inter/intra accuracy and precision assessment, selectivity, stability, extraction recovery, etc.
We used simulated mRNA drugs (EGFP mRNA) to validate RT-qPCR analysis platforms. Considering that the liver is the main target and metabolic tissue typically for LNP-mRNA drugs, we selected SD Rat liver tissue to completely validate the qPCR method. We designed our in-house primers and probes for EGFP and theoretically validated their specificity using NCBI BLAST. Through experimentation, these primers and probes exhibit good specificity and amplification efficiency. The RT-qPCR linear range is between 1 pg/mL and 1000 ng/mL. The standard curves for whole blood and liver are listed in Figure 3.
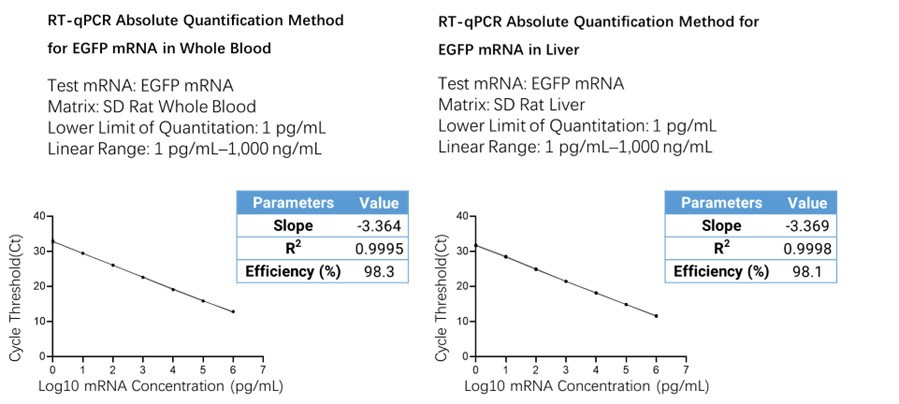
Figure 3. Schematic diagram of the absolute quantification of EGFP mRNA in the liver with cycle number threshold (Ct) and mRNA concentration after log10 (pg/mL) on the ordinate
We determined the within-batch/between-batch precision and accuracy, selectivity, and stability for the RT-qPCR method validation. Three independent runs were evaluated spanning three days by two analysts, showing the accuracy (%Bias) and precision (%CV) of within-batch/between-batch. The data demonstrated that three batches were robust and reproducible, as the %CV and %Bias all meet the acceptance criteria (Tables 1 and 2). Three levels of spiked quality control samples (ULOQ, HQC, and LLOQ) were prepared in ten individuals to check the selectivity parameter of the method. Exceeding 80% of spiked QC samples (17/18) satisfied the acceptance criteria, suggesting the method exerted good selectivity. Meanwhile, the short-term stability study concluded that both high- and low-spiked quality control samples (HQC and LQC) were stable during freeze-thaw cycles and bench-top storage.
Table 1. Within-batch/between-batch precision and accuracy assessment of standard curve samples
Inter/Intra Accuracy and Precision Evaluation of Standard Samples (Liver) | ||||||||
Run identification |
| Nominal concentration (ng/mL) | ||||||
1×10³ | 1×10² | 1×101 | 1×100 | 1×10⁻¹ | 1×10⁻² | 1×10⁻³ | ||
Run1 | Ct_CV (%) | 1.1 | 0.2 | 0.4 | 0.2 | 0.5 | 0.5 | 0.5 |
Mean determined concentration (ng/mL) | 9.29×10² | 9.98×101 | 1.05×101 | 1.11×100 | 1.03×10⁻¹ | 9.10×10⁻³ | 9.98×10⁻⁴ | |
Intra-assay precision (%) | 8.8 | 2.5 | 4.8 | 2.8 | 8.4 | 10.5 | 10.8 | |
Bias (%) | -7.1 | -0.2 | 5.1 | 10.8 | 2.9 | -9.0 | -0.2 | |
n | 2 | 2 | 2 | 2 | 2 | 2 | 2 | |
Run2 | Ct_CV (%) | 0.7 | 0.9 | 0.7 | 0.6 | 0.9 | 0.3 | 0.8 |
Mean determined concentration (ng/mL) | 9.53×10² | 1.02×10² | 1.02×101 | 1.04×100 | 1.04×10⁻¹ | 9.41×10⁻³ | 1.01×10⁻³ | |
Intra-assay precision (%) | 5.2 | 8.9 | 8.6 | 8.9 | 14.6 | 5.7 | 17.0 | |
Bias (%) | -4.7 | 2.3 | 2.2 | 3.7 | 4.1 | -5.9 | 0.8 | |
n | 2 | 2 | 2 | 2 | 2 | 2 | 2 | |
Run3 | Ct_CV (%) | 0.6 | 0.7 | 0.2 | 0.4 | 0.3 | 0.3 | 0.3 |
Mean determined concentration (ng/mL) | 9.27×10² | 1.03×10² | 1.07×101 | 1.09×100 | 9.96×10⁻² | 8.32×10⁻³ | 1.09×10⁻³ | |
Intra-assay precision (%) | 4.8 | 7.3 | 2.9 | 5.8 | 4.4 | 6.3 | 5.8 | |
Bias (%) | -7.3 | 2.8 | 7.0 | 8.9 | -0.4 | -16.8 | 9.3 | |
n | 2 | 2 | 2 | 2 | 2 | 2 | 2 | |
Overall | Mean determined concentration (ng/mL) | 9.36×10² | 1.02×10² | 1.05×101 | 1.08×100 | 1.02×10⁻¹ | 8.94×10⁻³ | 1.03×10⁻³ |
Inter-assay precision (%) | 5.2 | 5.5 | 5.0 | 5.7 | 8.1 | 8.3 | 10.2 | |
Bias (%) | -6.4 | 1.6 | 4.8 | 7.8 | 2.2 | -10.6 | 3.3 | |
n | 6 | 6 | 6 | 6 | 6 | 6 | 6 | |
Table 2. Within-batch/between-batch precision and accuracy assessment of quality control samples
Inter/Intra Accuracy and Precision Evaluation of QC Samples (Liver) | ||||||
Run identification |
| Nominal concentration (ng/mL) | ||||
1×10³ | 5×10² | 5×100 | 5×10⁻² | 1×10⁻³ | ||
Run1 | Mean determined concentration (ng/mL) | 1.01×10³ | 5.52×10² | 4.87×100 | 4.87×10⁻² | 9.11×10⁻⁴ |
Intra-assay precision (%) | 19.7 | 12.3 | 6.2 | 6.7 | 12.9 | |
Bias (%) | 0.8 | 10.4 | -2.7 | -2.5 | -8.9 | |
n | 6 | 6 | 6 | 6 | 6 | |
Run2 | Mean determined concentration (ng/mL) | 8.37×10² | 4.94×10² | 4.73×100 | 4.12×10⁻² | 8.08×10⁻⁴ |
Intra-assay precision (%) | 17.5 | 14.0 | 7.3 | 9.4 | 32.8 | |
Bias (%) | -16.3 | -1.2 | -5.4 | -17.7 | -19.2 | |
n | 6 | 6 | 6 | 6 | 6 | |
Run3 | Mean determined concentration (ng/mL) | 9.91×10² | 5.64×10² | 4.84×100 | 6.25×10⁻² | 7.13×10⁻⁴ |
Intra-assay precision (%) | 27.1 | 10.6 | 10.8 | 45.7 | 19.3 | |
Bias (%) | -0.9 | 12.7 | -3.1 | 25.1 | -28.7 | |
n | 6 | 6 | 6 | 6 | 6 | |
Overall | Mean determined concentration (ng/mL) | 9.45×10² | 5.37×10² | 4.81×100 | 5.08×10⁻² | 8.11×10⁻⁴ |
Inter-assay precision (%) | 0.2 | 0.1 | 0.1 | 0.4 | 0.2 | |
Bias (%) | -5.5 | 7.3 | -3.7 | 1.6 | -18.9 | |
n | 18 | 18 | 18 | 18 | 18 | |
Overall, the RT-qPCR platform, which is frequently employed for mRNA bioanalysis, offers excellent sensitivity, specificity, and robustness for the quantitation of mRNA therapeutics. In addition to liver tissue, we established and optimized sample pretreatment methods for other matrix types such as serum/plasma and other challenging-to-homogenize tissues such as muscle, brain, etc. All these efforts may help to meet the research needs for DMPK studies and tissue distribution of mRNA therapeutics.
Novel Lipid Bioanalysis
Lipid nanoparticles (LNPs) typically consist of four classes of components: cholesterol, neutral auxiliary phospholipids, ionizable cationic lipids, and PEG lipids. Cholesterol and neutral auxiliary phospholipids are commonly found in other similar carriers and have acquired FDA approval. Therefore, more kinetic research and related biological studies are frequently not needed for these two lipids. The ionizable cationic lipids are versatile components and optimization units for different lipid nanoparticles, and they determine the targeting features as well as the kinetic characteristics. These novel lipid components are not used in marketed drugs; thus, related bioanalysis and the in vitro and in vivo ADME assays must be carried out during DMPK studies.
The cationic lipid determines the delivery and transfection efficiency of the LNP delivery system. It consists of three crucial structural regions, including the polar head, the connecting chain, and the hydrophobic tail. Among them, the polar head affects the lipid charge state and lysosomal escape process. The connecting chain impacts the chemical stability and biodegradability of cationic liposomes. The hydrophobic tail affects the lipid behavior, not only providing enough mobile phase for the lipid bilayer but also facilitating the lipid fusion of cationic liposomes in vivo.
The LC-MS/MS platform is the main platform for novel lipid bioanalysis of lipid nanoparticles. However, developing these methods is challenging due to their intricate structure, the large number of isomers, and susceptibility to interference from endogenous substances in vivo. During the analysis, special attention should be paid to the problems of non-specific adsorption, strong binding to the chromatographic column, and poor extraction recovery due to their special structures.
Bioanalysis of Expressed Proteins in mRNA Therapeutics
The analysis of expressed proteins can be performed using conventional semi-quantitative Western blot, LBA-based absolute quantitation platforms such as ELISA or MSD, or microscopic imaging-based IHC, depending on the goal and stage of the investigation. The following table lists the advantages and disadvantages of the corresponding platforms (Table 3). At present, LBA-based platforms can be developed to quantify expressed proteins in various types of body fluids and tissues. A sandwich- or competition-ELISA is commonly used based on the availability of key reagents.
Table 3. Advantages and disadvantages of different analytical platforms for mRNA-expressed protein analysis
Platform | Benefits | Disadvantages |
Ligand Binding Assay (LBA) | Absolute Quantitation Good specificity High sensitivity | High dependence on critical reagents No spatial information |
Western blot (WB) | The method is simple and easy Less critical reagent dependency | Susceptible to endogenous interference Semi-quantitative No spatial information |
Immunohistochemistry (IHC) | Spatial distribution information Multi-staining (co-localization study) | Semi-quantitative or qualitative Susceptible to endogenous interference |
Immunogenicity Analysis and ADA Assays
Due to the relative complexity of mRNA drug components, distinct components may generate distinct immunogenicity. Therefore, it is important to take account of the varying immunogenicity of distinct components. This is the case with LNP-carried mRNA drugs. The immunogenicity analysis usually includes the following three parts: immunogenicity analysis of the expressed protein, the mRNA itself, and the carrier (especially PEG).
It is widely acknowledged that the immunogenicity of mRNA itself is very low, and it is difficult to trigger the production of anti-drug antibodies (ADAs). However, its sequence has the potential to activate specific Toll-like receptors (TLRs) as well as immune pathways. Generally, the samples can be retained for testing during the preclinical stage, even if there is no regulatory requirement for investigation.
The immunogenicity of the carrier varies greatly depending on the carrier, and LNPs are generally considered to be relatively lower-immunogenic vectors. LNP ADA (positive control) preparation is difficult and generally not investigated. However, it is worth noting that PEG-modified ingredients are potentially immunogenic substances, and the body may have pre-existing anti-PEG antibodies that also cause accelerated drug clearance. Because pre-existing or treatment-emergent anti-PEG antibodies can cause accelerated blood clearance (ABC), evaluating the immunogenicity of PEGylated LNP components via a direct ADA assay is strongly recommended.
The protein expressed by mRNA therapeutics represents another significant potential source of immunogenicity. It may have potential risks related to the differences in protein sequences and folding patterns compared to endogenous proteins. It may also increase the risk associated with the quantity and duration of mRNA protein expression.
The immunogenicity assays of mRNAs and their delivery vehicles usually employ the direct ADA assay method, while immunogenicity assays of expressed proteins often use the ADA bridging method. A schematic of the test format is shown below (Figure 4).
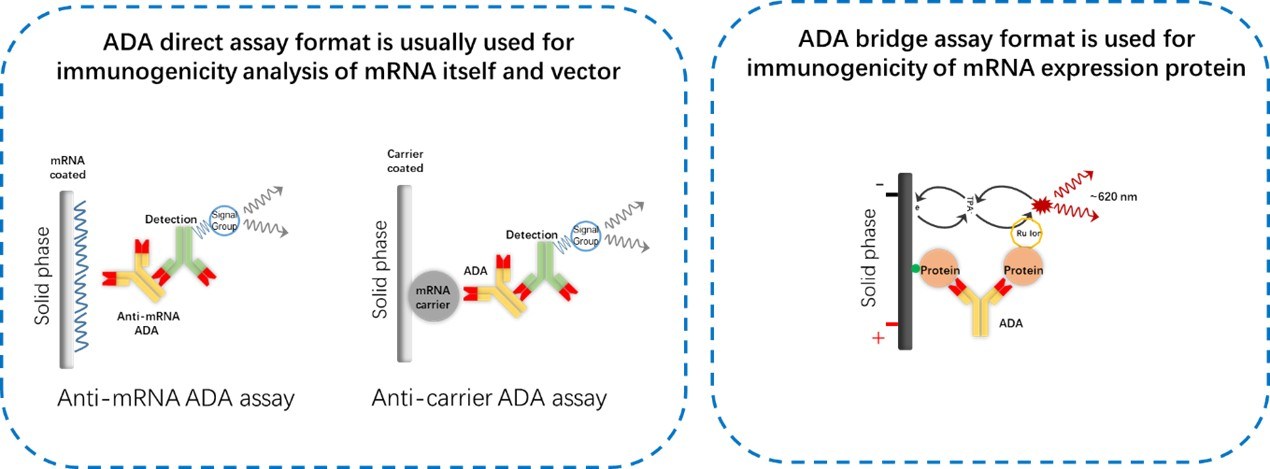
Figure 4. Schematic diagram of mRNA immunogenicity analysis test formats. An ADA assay direct format is usually used for immunogenicity analysis of mRNA itself and the vector, while an ADA assay bridging format is used for the immunogenicity of the mRNA-expressed protein
Biomarker Analysis for mRNA Therapeutics
Preclinical biomarker analysis of mRNA drugs mainly includes immune response analysis (including analysis of immunophenotyping, cytokine/immune factor, and immunoglobulin subtype), effector protein-related pathway biomarker analysis, etc. The analysis of biomarkers for mRNA therapeutics or vaccines is different, generally centered around assessing the safety and efficacy of mRNA drugs, choosing appropriate biomarkers, and validating analytical methods through fit-for-purpose design.
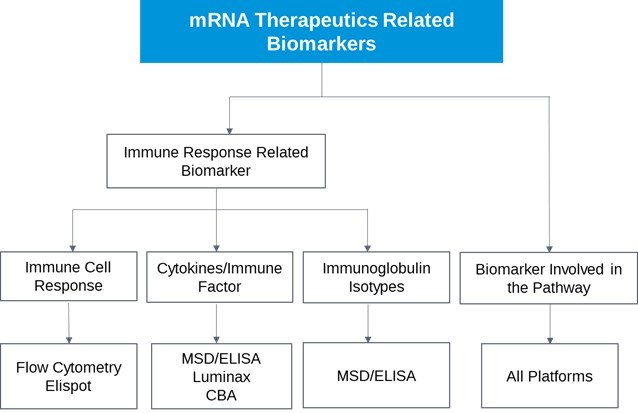
Figure 5. Schematic diagram of mRNA drug-related biomarker analysis, including immune response analysis and effector protein downstream pathway biomarker analysis[3]
Conclusion
mRNA can be translated into any protein or peptide by the ribosome expression system, opening new avenues for the development of mRNA therapeutics, vaccinations, as well as personalized treatments. With the huge success of COVID-19 mRNA vaccines, enthusiasm for the research and development of mRNA vaccines or therapeutic drugs is also rising. Relative to traditional macromolecular drugs, mRNA drugs have a more intricate structure. Thus, more bioanalytical platforms and strategies are involved in the study of the ADME, efficacy, and safety characteristics. Given the diversity in mRNA drug designs, tailored mRNA bioanalysis methods should be developed for each specific drug.
Authors: Huan Yan, Ph.D., Jinlian Lu, Miaomiao Song, Ph.D., Lili Xing
Talk to a WuXi AppTec expert today to get the support you need to achieve your drug development goals.
Committed to accelerating drug discovery and development, we offer a full range of discovery screening, preclinical development, clinical drug metabolism, and pharmacokinetic (DMPK) platforms and services. With research facilities in the United States (New Jersey) and China (Shanghai, Suzhou, Nanjing, and Nantong), 1,300+ scientists, and over fifteen years of experience in Investigational New Drug (IND) application, our DMPK team at WuXi AppTec are serving 1,800+ global clients, and have successfully supported 2,100+ IND applications.
Reference
[1] Henderson, Neil, and Amanda Wilson. Measurement of mRNA therapeutics: method development and validation challenges. Bioanalysis 11.21 (2019): 2003-2010.
[2] Wissel, Mark, et al. Recommendations on qPCR/ddPCR assay validation by GCC. Bioanalysis 14.12 (2022): 853-863.
[3] Liang Shen, editor. Drug Metabolism and Pharmacokinetics: Frontiers, Strategies, and Applications. Wiley. 2025. http://doi.org/10.1002/9781394300150.


FAQ
-

What are the key bioanalytical challenges in DMPK studies for LNP-mRNA therapeutics?


-
How is absolute mRNA quantitation validated given the current lack of specific regulatory guidelines?
-
What makes the bioanalysis of novel cationic lipids in LNPs so difficult?
-
Which components of an mRNA-LNP therapeutic require immunogenicity (ADA) testing?
-
How do you choose the right platform for analyzing expressed proteins in mRNA studies?
Related Services and Platforms


-
 DMPK BioanalysisLearn More

-
Novel Drug Modalities DMPK Enabling PlatformsLearn More
-
Novel Drug Modalities BioanalysisLearn More
-
Small Molecules BioanalysisLearn More
-
Bioanalytical Instrument PlatformLearn More
-
PROTAC DMPK ServicesLearn More
-
ADC DMPK ServicesLearn More
-
Antibody-Oligonucleotide Conjugate (AOC) DMPK ServicesLearn More
-
Oligo DMPK ServicesLearn More
-
PDC DMPK ServicesLearn More
-
Peptide DMPK ServicesLearn More
-
mRNA DMPK ServicesLearn More
-
Covalent Drugs DMPK ServicesLearn More



Stay Connected
Keep up with the latest news and insights.

