



Matrix Effects in LC-MS/MS Bioanalysis: Assessment and Mitigation Strategies
-

Articles
-

Sep 23, 2026
Introduction to the Matrix Effect in DMPK Bioanalysis
Biological samples are compositionally complex and contain abundant endogenous constituents, including proteins, inorganic salts, phospholipids, and peptides. During LC-MS/MS bioanalysis, components that coelute with the analyte can affect the mass-spectrometric response, producing signal enhancement or suppression. This phenomenon is known as the matrix effect (ME). Matrix effects can directly compromise assay sensitivity, accuracy, and precision, and may ultimately bias pharmacokinetic interpretation. This article describes the mechanisms and principal sources of matrix effects and provides a structured overview of established approaches for their assessment and mitigation in DMPK bioanalysis.
Origin of the Matrix Effects in Biological Matrices
Mechanisms of Matrix Effects Formation
Matrix effects are generally attributed to competition during ionization between the target analyte and coeluting endogenous or exogenous species.
Using electrospray ionization (ESI) and atmospheric pressure chemical ionization (APCI) as examples, the molecular ionization processes are briefly described as follows.
Electrospray ionization
Following chromatographic separation, the liquid sample is charged by an electric field at the capillary emitter. Heated auxiliary gas (typically nitrogen) accelerates rapid droplet evaporation in the ion source. As the solvent evaporates, charge density at the droplet surface builds up to a critical level until Coulomb fission occurs, ultimately generating gas-phase molecular ions that are transferred into the mass spectrometer[1]. (Figure 1 depicts the process in positive-ion mode.)
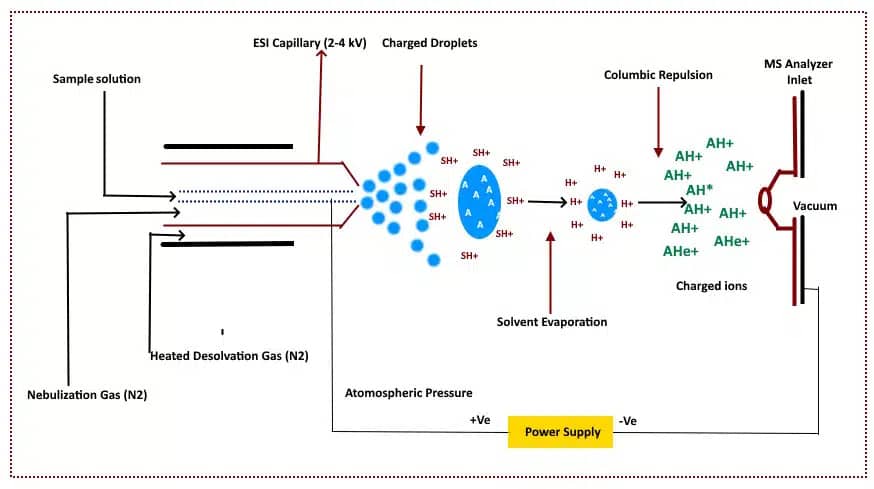
Figure 1. Schematic of electrospray ionization[2]
Atmospheric-pressure chemical ionization
The liquid sample is first delivered to a heated tube, where the solvent is vaporized. Under the high voltage of a corona-discharge needle, solvent molecules are ionized to form a primary plasma. This plasma then undergoes gas-phase ion-molecule reactions with the desolvated sample molecules, generating charged molecular ions of the analyte[3]. Figure 2 depicts the process in positive-ion mode.
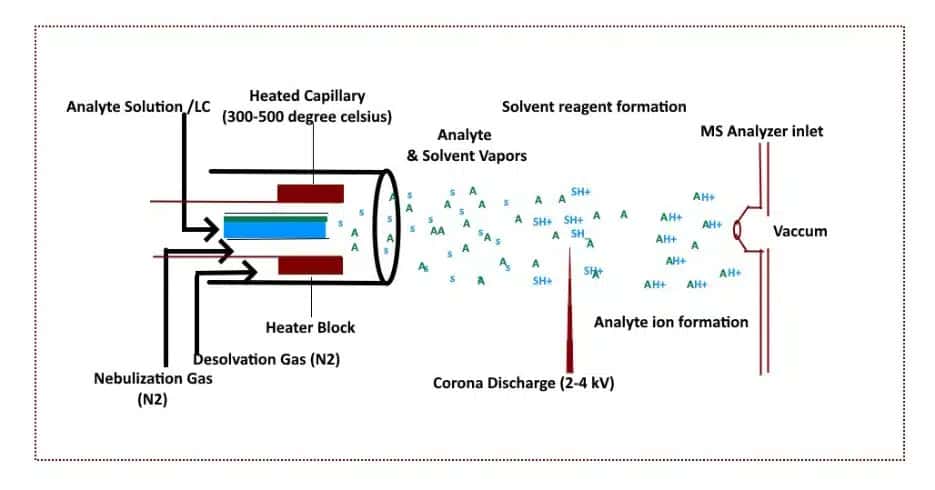
Figure 2. Schematic of atmospheric-pressure chemical ionization[2]
In summary, ESI charges droplets before desolvation, whereas APCI desolvates the sample before ionization. Only charged molecular ions can be separated and detected by a quadrupole mass spectrometer. Using ESI as an example, Figure 3 summarizes six major mechanisms by which matrix components affect ionization.
Charge competition
High concentrations of matrix components, including hydrophobic lipids, polysorbate surfactants, mobile-phase additives, and ion-pairing reagents, can restrict analyte access to the droplet surface and compete for available charge. The resulting decrease in analyte charging efficiency is a principal cause of ion suppression[4,5].
Altered droplet properties
Some matrix components increase droplet viscosity and surface tension, hindering solvent evaporation and Coulomb fission. Fewer ions consequently reach the gas phase, resulting in signal suppression[6].
Effect of analyte polarity
The magnitude of the matrix effect may depend on analyte class and polarity. Highly polar analytes tend to partition into the aqueous interior of the droplet rather than the surface, thereby lowering surface tension. This behavior makes them particularly susceptible to ion suppression[6].
Coprecipitation
An analyte may coprecipitate with nonvolatile matrix constituents and become entrapped in the resulting solid, preventing transfer into the gas phase as the solvent evaporates[7].
Gas-phase proton competition
After entering the gas phase, analyte ions may still be affected by coexisting matrix components. Neutral matrix species can compete for charge through gas-phase proton-transfer reactions. Molecules with greater gas-phase basicity may abstract a proton from the analyte, neutralize its charge, and suppress the signal[8].
Impaired ion transmission
An abundance of charged matrix-derived ions may accumulate at the mass-spectrometer inlet, increase resistance within the ion-transfer path, and impede transmission of target ions to the detector[9].
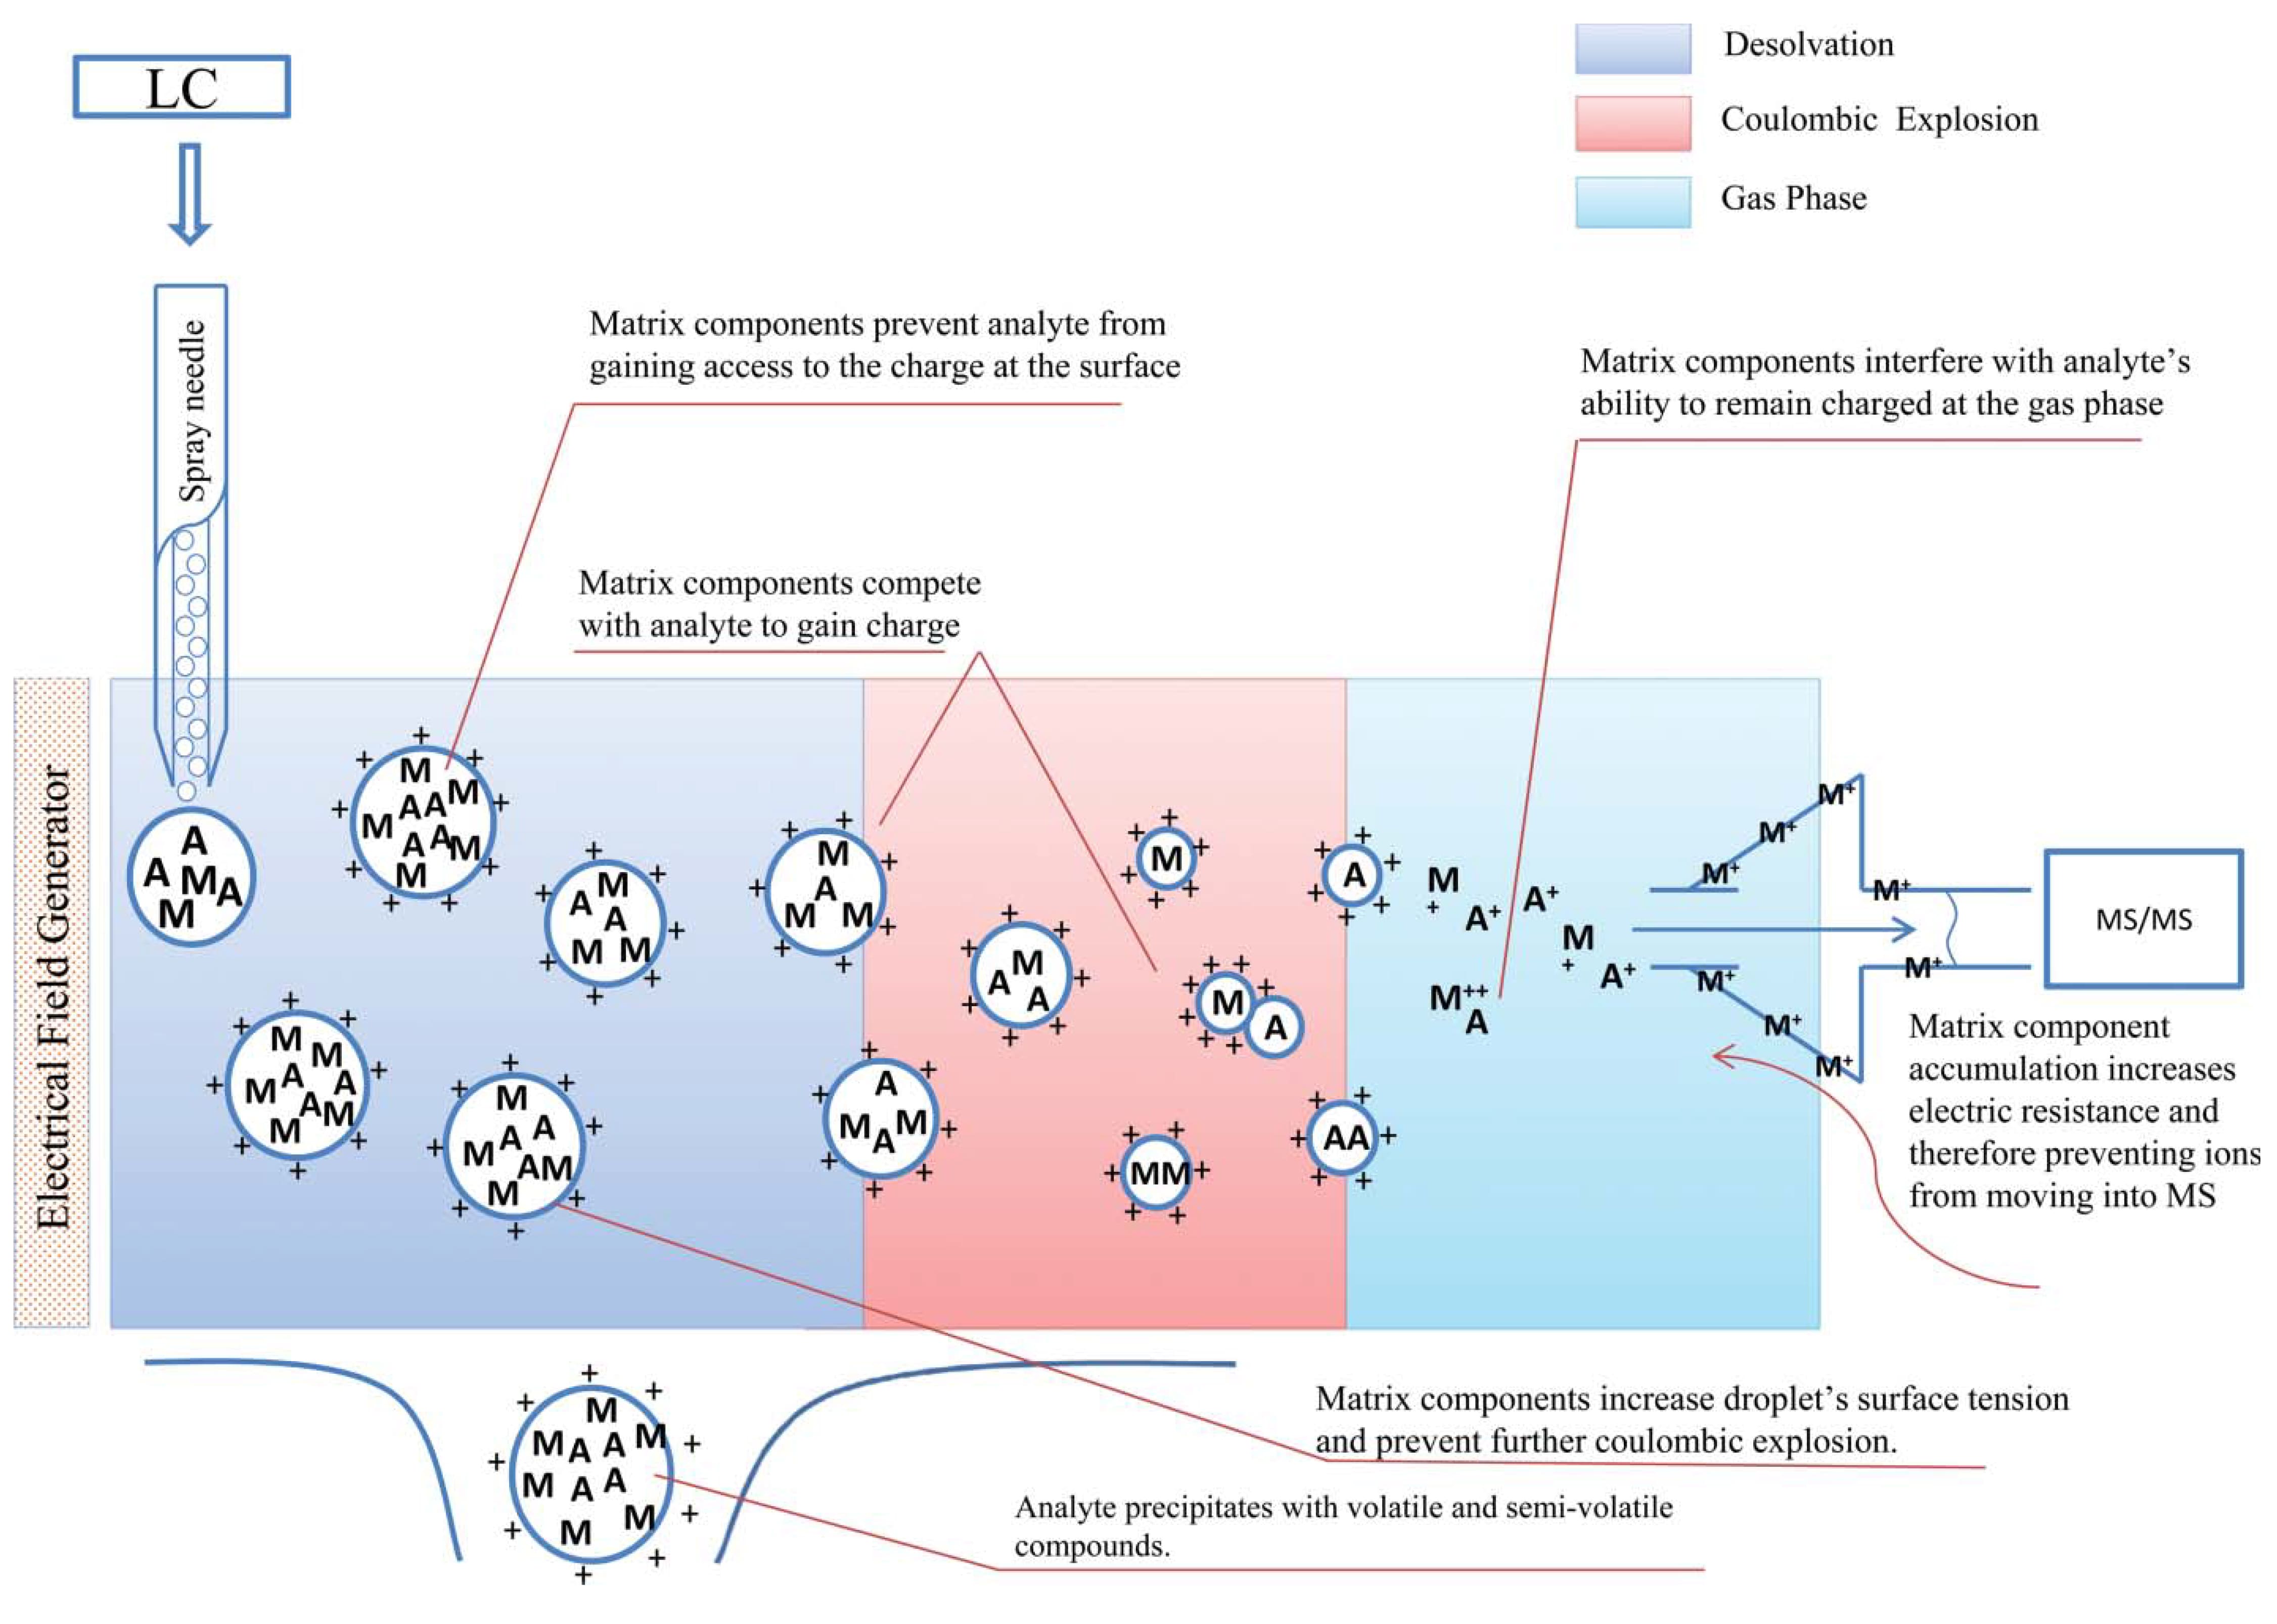
Figure 3. Mechanisms of matrix effects in ESI[9]
Because ESI and APCI ionize analytes by different mechanisms, matrix components can affect ESI in both the solution and gas phases, whereas their effect on APCI is primarily gas-phase. ESI therefore presents more opportunities for matrix interference. Biological matrices contain high concentrations of nonvolatile constituents and electrolytes, making ESI generally more susceptible than APCI. Nevertheless, APCI can also be substantially affected when the matrix contains abundant ionizable species that dominate gas-phase proton competition with the analyte[4,10].
Principal Sources of Matrix Effects
Endogenous components
Endogenous matrix components include phospholipids, bile salts, high concentrations of inorganic salts, proteins, peptides, and metabolites. Phospholipids are of particular concern and are among the primary causes of matrix effects; they are not completely removed by routine protein precipitation. Their long hydrophobic chains favor coelution with lipophilic analytes under reversed-phase conditions. When chromatographic elution strength is inadequate, phospholipids may also accumulate on the analytical column, progressively worsening matrix effects over successive injections. Highly polar salts, by contrast, are poorly retained and are typically eluted near the column dead time.
Exogenous components
Exogenous components are introduced after sample collection rather than being intrinsic to the biological matrix. Potential sources include formulation excipients administered in vivo, anticoagulants, plasticizers from collection and storage containers, and stabilizers or buffers introduced during extraction. Such components affect the result only if they are extracted and coelute with the analyte during ionization. Study samples collected after dosing may contain formulation components that are absent from calibration standards and quality-control (QC) samples prepared in blank matrix. In one internal study, the formulation contained beta-cyclodextrin and polysorbate 20. Following protein precipitation (PPT) sample preparation, the verapamil internal-standard peak area in study samples differed markedly from those in calibration standards and QC samples (Figure 4). Thus, even when an assay satisfies all predefined acceptance criteria, formulation components present only in study samples may cause measured concentrations to deviate from the true values. Common formulation vehicles such as methylcellulose and dimethyl sulfoxide are generally less likely to cause a matrix effect in LC-MS. In contrast, beta-cyclodextrin and polyoxyethylene-containing excipients such as polysorbate 80 and PEG 400 can produce analyte-dependent matrix effects and warrant particular attention[4].
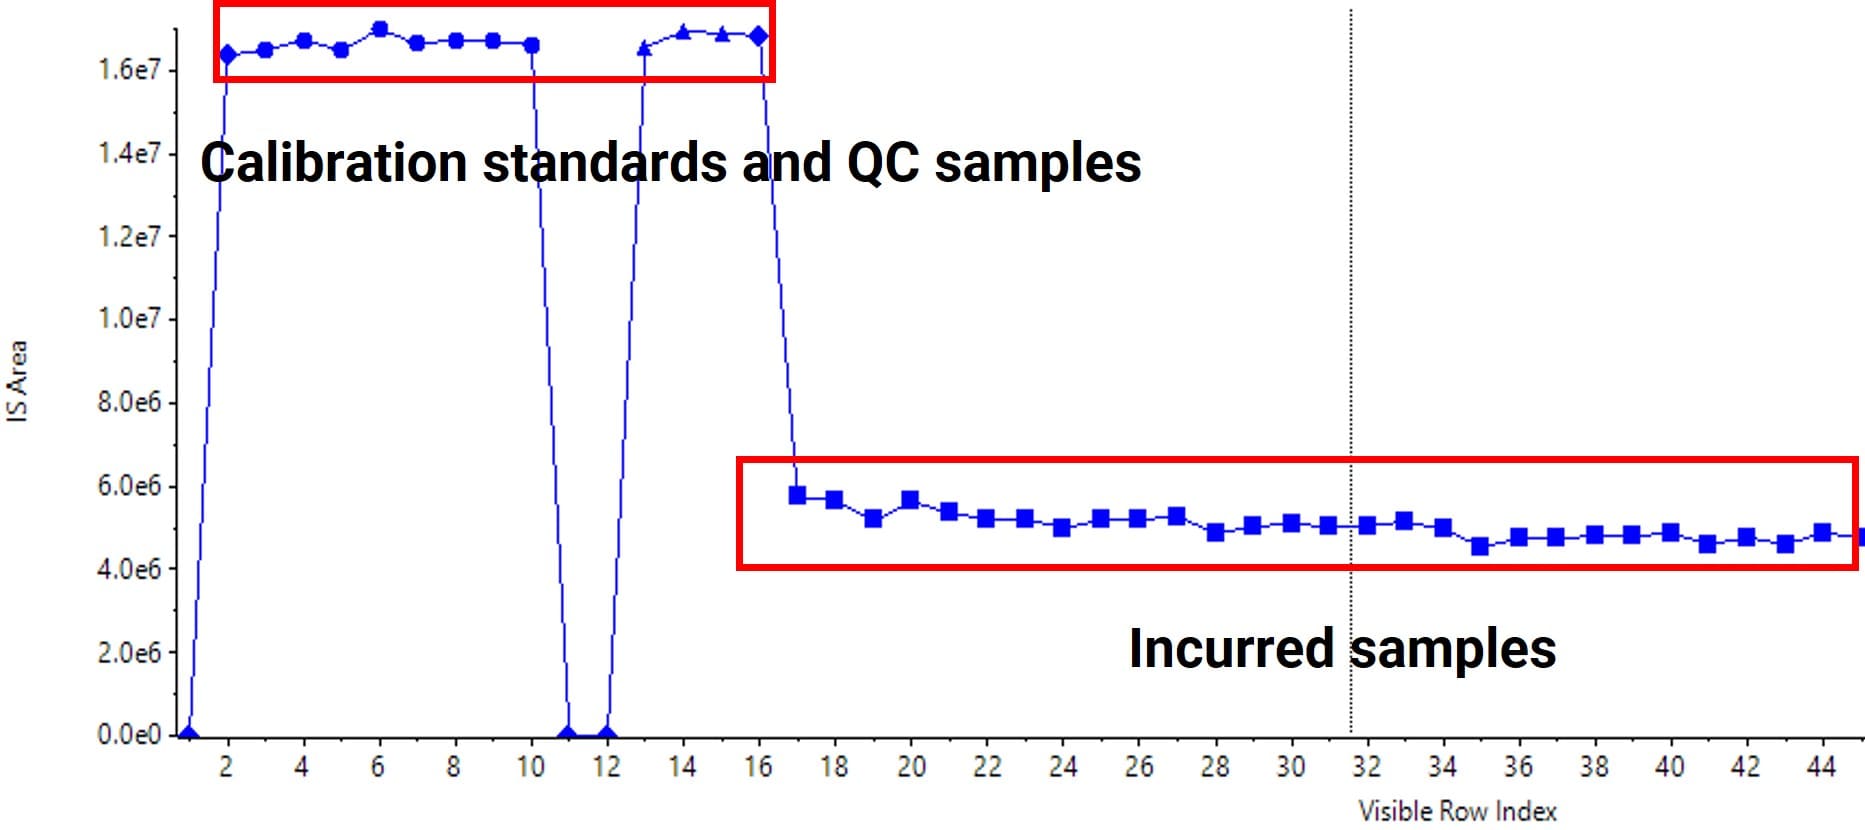
Figure 4. Internal-standard peak areas in calibration standards, QC samples, and incurred samples
Assessment of Matrix Effects in LC-MS/MS Bioanalysis
A typical bioanalytical run includes double blanks, blanks containing internal standard, calibration standards, QC samples, and incurred samples. Study-sample concentrations are calculated from a regression model fitted to the calibration standards. Any difference in matrix effect between calibrators and study samples can therefore bias the measured concentrations.
Evaluation of relative matrix effects is consequently critical in routine LC-MS/MS bioanalysis. Using blank matrix as the reference, five approaches are commonly used to characterize relative matrix effects.
Post-column infusion: A constant amount of analyte solution is infused through a tee into the LC eluent by a syringe pump. Extracts of blank matrix and matrix containing the component of interest are then injected and their chromatographic profiles compared. A decrease in signal identifies regions of ion suppression; an increase indicates ion enhancement. This approach is useful during method development for qualitative mapping of matrix effect and for identifying affected retention-time windows.
Monitoring of diagnostic ion transitions: During method development, diagnostic transitions can be added to monitor potential interferents, for example m/z 184 → 184 or 184 → 125 for phospholipids and m/z 133 → 89 for polyoxyethylene surfactants[11]. The purpose is to verify chromatographic separation of the analyte from relevant matrix components and thereby avoid potential matrix effects.
Standard addition of formulation components: Drug formulations introduce exogenous vehicles into biological study samples, whereas the blank matrix used for calibration standards generally contains no such vehicle. Samples at a defined analyte concentration are prepared in blank matrix and in matrix spiked with the formulation vehicle at the proportion calculated from the administered dose volume. Comparable MS responses indicate no vehicle-related matrix effect; a difference outside the predefined acceptance range indicates that mitigation is required. This approach allows a targeted, quantitative assessment of formulation-component effects.
Dilution of incurred samples: The matrix composition of incurred samples may differ from blank matrix not only because of the dosing vehicle but also because of structurally related metabolites or degradation products that coelute with the analyte. A study sample can be diluted with blank matrix and compared with the undiluted sample. If the MS response changes in proportion to the dilution factor, no material difference in matrix effect is indicated. Compared with vehicle-spiking experiments, this approach more fully captures the aggregate difference between the incurred sample and blank matrix.
Comparison across matrix lots or sources: Low- and high-concentration QC samples are prepared using matrix from multiple donors or lots to assess between-matrix variability. For plasma assays, hemolyzed and lipemic matrices should be evaluated when appropriate. The presence of a meaningful matrix difference is determined from the bias of the mean measured value (Bias%) and the coefficient of variation (%CV) at each concentration relative to predefined acceptance criteria. This approach quantitatively assesses the contribution of endogenous matrix components.
These approaches are often used in combination. Table 1 compares the pros and cons of common matrix effect evaluation methods.
Table 1. Comparison of commonly used approaches for evaluating matrix effects
Method | Function | Advantages | Limitations |
Post-column infusion | Qualitative | Visually reveals the regions and extent of ion enhancement or suppression. | Operation is relatively cumbersome. |
Monitoring of diagnostic ion transitions | Qualitative | Clearly determines whether potential matrix-effect components coelute with the analyte. | Applicable only to known components. |
Standard addition of formulation components | Quantitative | Directly evaluates the impact of formulation components. | Differences in Cmax among formulations make it difficult to calculate the exact spiking amount. |
Dilution of incurred samples | Quantitative | Highly accurate for evaluating authentic incurred samples. | Requires prior acquisition of incurred samples. |
Comparison across matrix lots/sources | Quantitative | Reflects individual matrix variability, mitigating method applicability risks. | Difficult to assess the difference in matrix effects between incurred samples and calibration standards. |
What Are the Best Strategies to Reduce and Eliminate the Matrix Effect
A matrix component can produce a matrix effect only if it is present in the final extract and coelutes with the target analyte. Seven practical strategies follow from this principle.
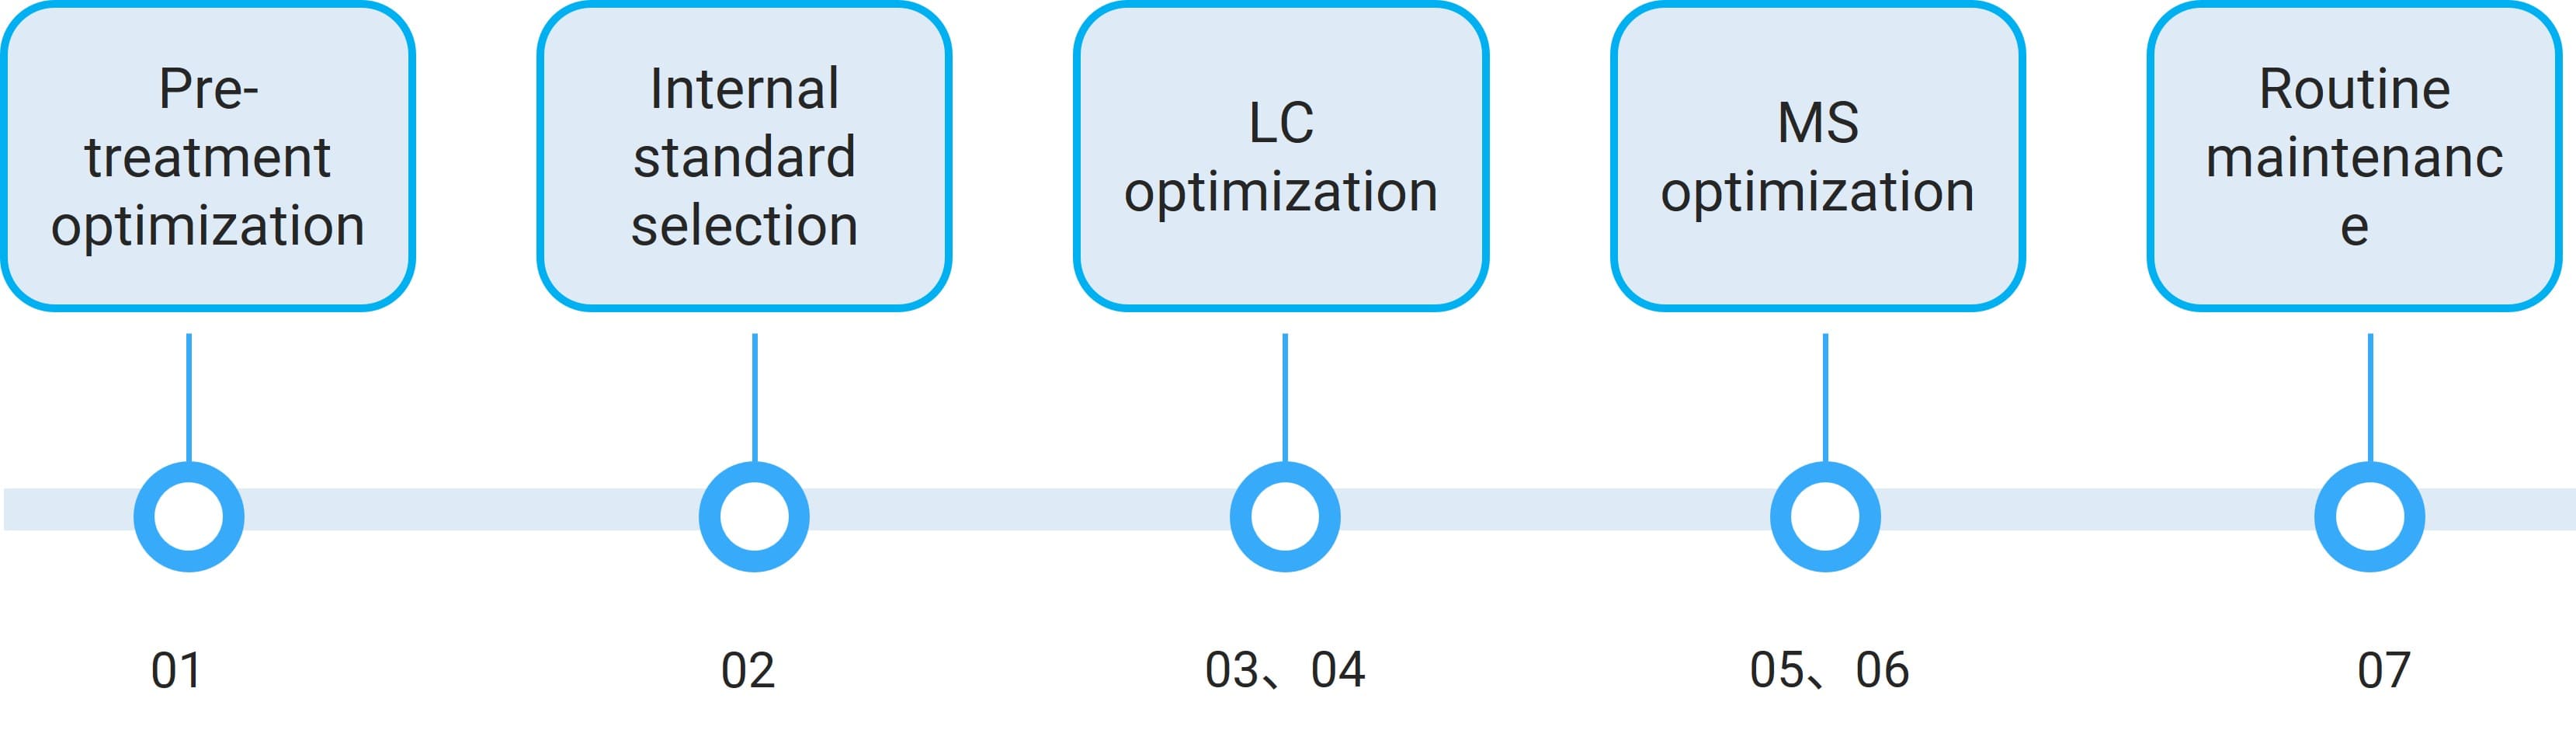
Figure 5. Strategies for reducing or eliminating matrix effects in bioanalysis
Sample preparation optimization
Protein precipitation (PPT) is widely used because it is simple and broadly applicable, but its cleanup capacity is limited. The final extract may retain phospholipids and other matrix components that cause ion suppression or enhancement. Options include selecting a more suitable extraction solvent, adjusting sample pH, increasing the precipitant-to-sample ratio when sensitivity permits, and diluting the supernatant. If PPT does not provide adequate cleanup, liquid-liquid extraction (LLE) or solid-phase extraction (SPE) should be considered.
Case 1 | Resolving matrix effects by adjusting extraction pH
As shown in Table 2, LQC samples prepared in six different matrix lots exhibited varying analyte responses and significant accuracy deviations when extracted with acetonitrile. After adding an appropriate amount of ammonium hydroxide to adjust the pH during sample preparation, the matrix effect was eliminated, and accuracy returned to the acceptable range.
Table 2. Resolution of matrix effects by adjustment of sample pH
Before Optimization | After Optimization (Addition of ammonium hydroxide) | ||||
Sample Name | Analyte Peak Area | Accuracy (%) | Sample Name | Analyte Peak Area | Accuracy (%) |
LQC-1 | 2.39E+04 | 134% | LQC-1 | 1.20E+04 | 109% |
LQC-2 | 2.19E+04 | 122% | LQC-2 | 1.22E+04 | 111% |
LQC-3 | 1.94E+04 | 108% | LQC-3 | 1.15E+04 | 105% |
LQC-4 | 1.39E+04 | 78% | LQC-4 | 1.03E+04 | 94% |
LQC-5 | 1.42E+04 | 79% | LQC-5 | 1.13E+04 | 103% |
LQC-6 | 1.54E+04 | 86% | LQC-6 | 1.07E+04 | 97% |
Case 2 | Resolving matrix effects by changing the extraction method
Highly lipophilic analytes can coelute with phospholipids during reversed-phase chromatography and consequently exhibit significant matrix effects. Compared with PPT, LLE can achieve efficient phospholipid removal during sample preparation and substantially reduce matrix effects. In Figure 6, the retention time of the diagnostic phospholipid fragment in the PPT extract closely overlapped the Glibenclamide peak, identifying phospholipids as the principal source of ion suppression. Switching to LLE markedly reduced phospholipid content in the injected extract and effectively eliminated the matrix effect.
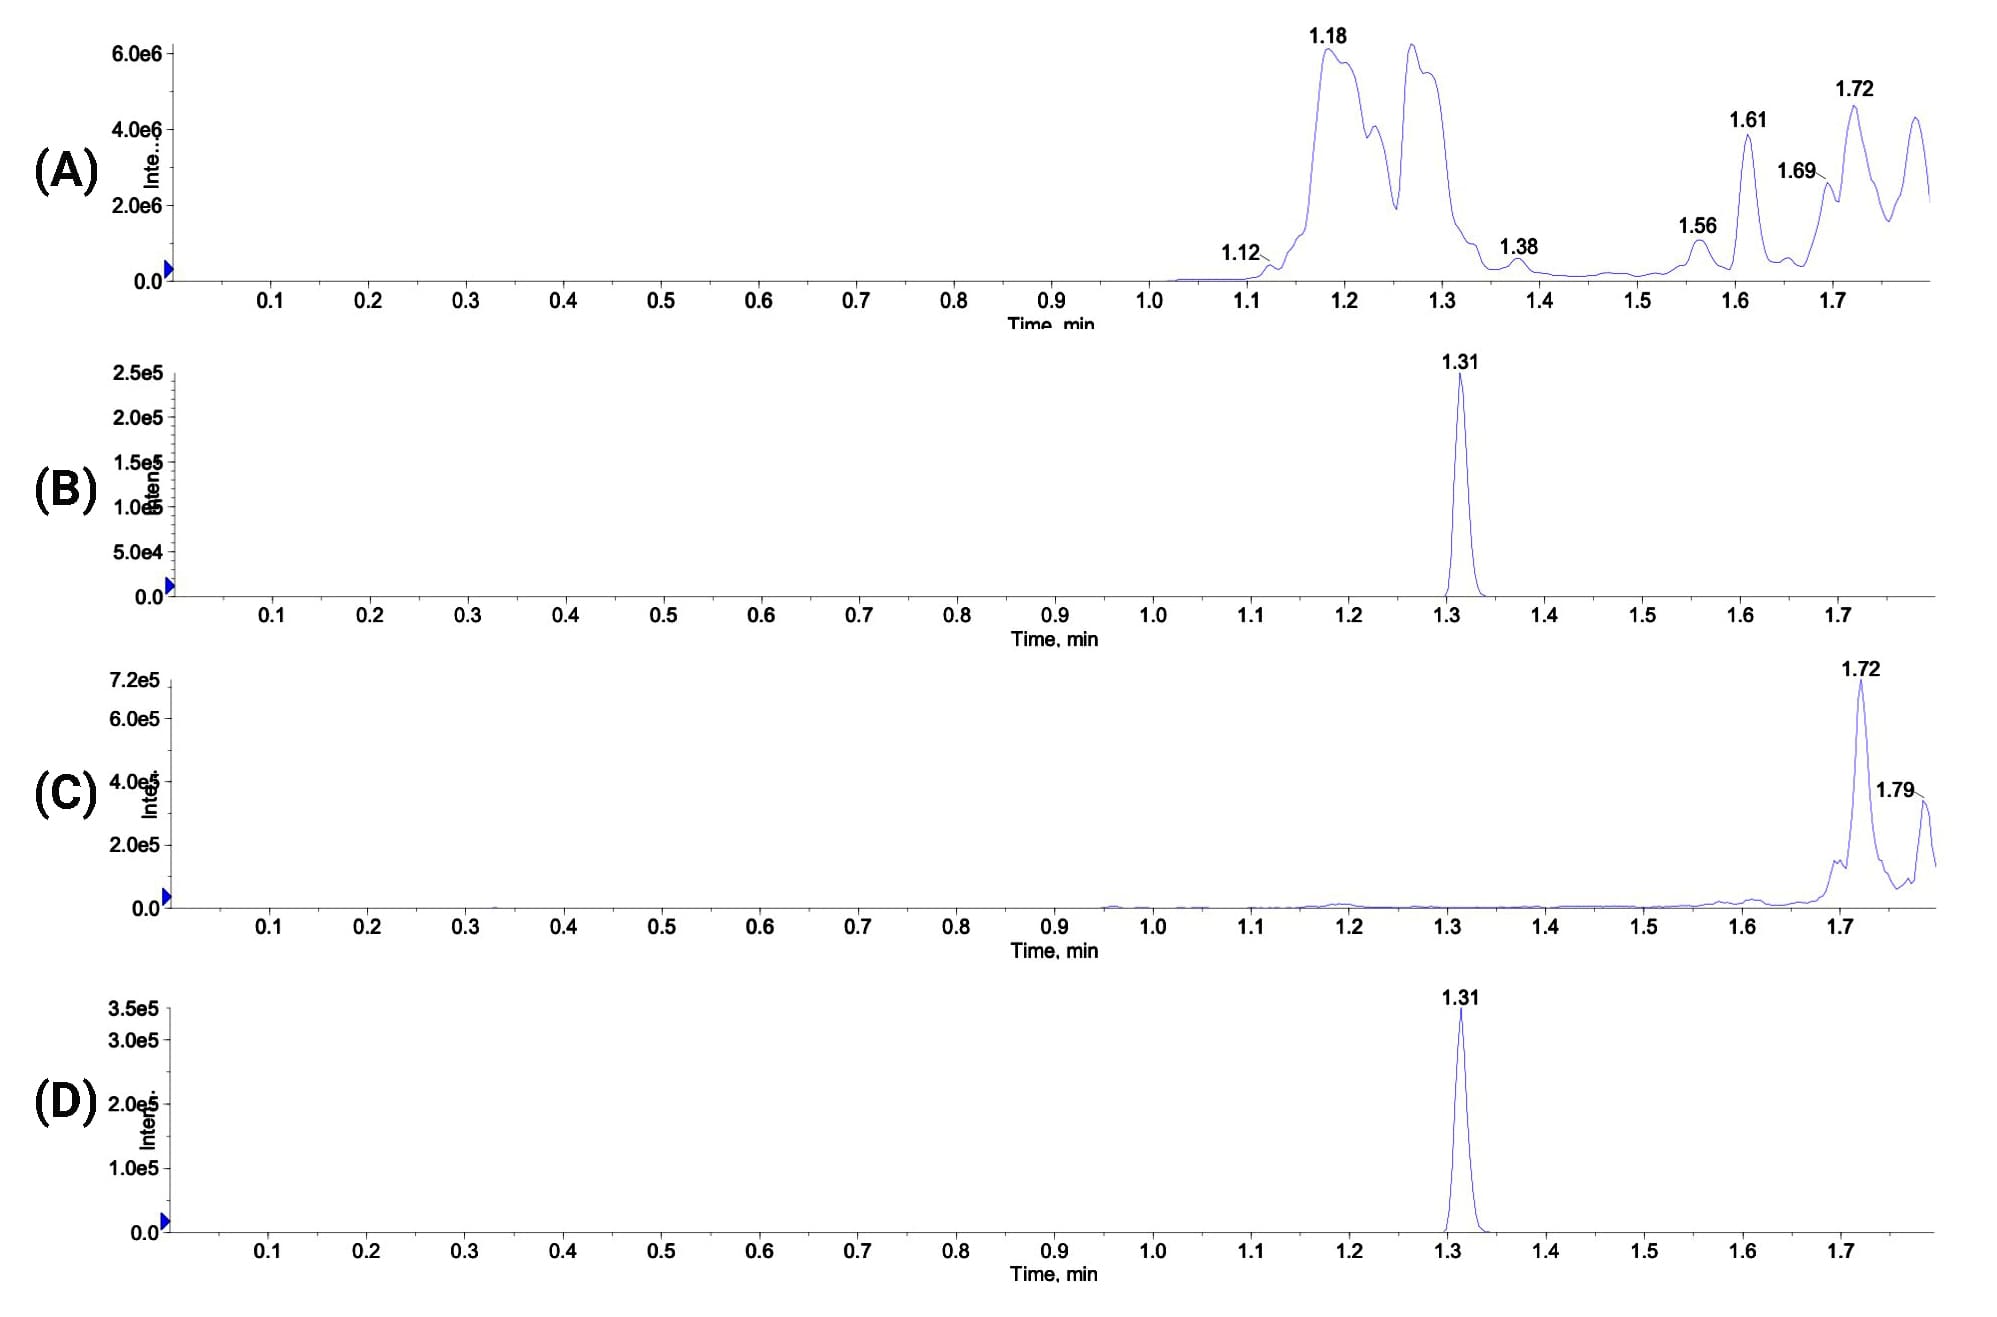
Figure 6. (A) Phospholipid chromatogram after PPT; (B) Glibenclamide chromatogram after PPT; (C) phospholipid chromatogram after LLE; (D) Glibenclamide chromatogram after LLE
Select an appropriate internal standard
An appropriately matched internal standard (IS) is central to compensating for matrix effects. If the IS and analyte undergo comparable suppression or enhancement, their absolute peak areas may change while the peak-area ratio remains stable. The IS should therefore resemble the analyte as closely as possible in physicochemical properties, ionization efficiency, and chromatographic retention. A stable-isotope-labeled internal standard (SIL-IS) is preferred.
Optimization of chromatographic separation
Because matrix effects arise from components that coelute with the analyte, chromatographic separation can eliminate the interference.
Screening of Columns with Different Stationary Phases
Columns with distinct bonded phases and retention mechanisms, such as C18, C4, phenyl, or pentafluorophenyl (PFP), can exploit differences in retention between the analyte and interferents.
Optimization of mobile phase
① Acid-base conditions. Acidic or basic modifiers alter the ionization states of the analyte and interferents and their interactions with the stationary phase. The resulting shift in retention can resolve coelution and eliminate the matrix effect.
Case 3
Table 3 shows a pronounced PEG-related matrix effect in a Propranolol assay using an acidic mobile phase, as indicated by substantial Bias%. Neither changing the column chemistry nor modifying the gradient corrected the problem. Under acidic conditions, PEG coeluted with Propranolol. Adjusting the mobile phase to neutral pH achieved chromatographic separation and eliminated the matrix effect.
Table 3. Evaluation of matrix effects by standard addition of formulation components: acidic versus neutral mobile phase
| Acidic Mobile Phase | Neutral Mobile Phase | ||
Sample Name | Peak Area Ratio | Bias (%) | Peak Area Ratio | Bias (%) |
C4 | 2.63E-03 | -32.30% | 1.10E-02 | -8.2% |
C4 with PEG | 1.78E-03 | 1.01E-02 | ||
② Screening of Organic Solvents. The polarity and elution strength of methanol, acetonitrile, isopropanol, and other organic solvents determine their selectivity for the analyte and interferents. Solvent selection can therefore materially affect chromatographic resolution.
Optimization of the chromatographic gradient
Appropriate modification of the chromatographic gradient can change the retention of the analyte and interferents and improve their separation.
Implementation of 2D Chromatography
Two columns with independent and complementary separation mechanisms can be coupled to improve resolution of the analyte from interfering matrix components.
Injection Volume Reduction
When MS sensitivity permits, reducing the injection volume or diluting the sample can decrease the amount of matrix entering the ion source, thereby attenuating matrix effects.
Switch of Ion Source from ESI to APCI
APCI is generally less susceptible to matrix effects than ESI. For analytes with adequate thermal stability, switching from ESI to APCI can materially improve assay performance.
Switch Ionization Modes (Positive/Negative)
Negative-ion mode generally has lower background than positive-ion mode on conventional instruments. Many matrix components responsible for interference do not ionize in negative mode and therefore do not compete with the analyte for charge.
Routine Instrument Maintenance
Matrix contaminants can progressively accumulate in LC flow paths, on the analytical column, and within the mass-spectrometer ion source. Routine preventive maintenance of both the LC system and ion source is therefore an essential component of matrix-effect control.
Summary
Matrix effects can materially compromise the accuracy, precision, and robustness of bioanalytical methods, thereby undermining the integrity and scientific validity of the resulting data. Control strategies should therefore prioritize prevention, relying on correction only as a secondary measure. Matrix-effect experiments should be incorporated early in method development, followed by continued monitoring during validation and routine sample analysis. Experimental conditions should be optimized as needed to ensure accurate and reliable data.
WuXi AppTec DMPK continues to advance its platforms for DMPK bioanalysis across multiple molecular modalities. The organization has established integrated in vivo bioanalysis capabilities spanning analyte screening through preclinical investigational new drug (IND) submission, supported by a rigorous quality-control system designed to ensure compliant and accurate data throughout drug development.
Authors: Jin Xie, Peiyun An, Jinlian Lu, Lili Xing
Talk to a WuXi AppTec expert today to get the support you need to achieve your drug development goals.
Committed to accelerating drug discovery and development, we offer a full range of discovery screening, preclinical development, clinical drug metabolism, and pharmacokinetic (DMPK) platforms and services. With research facilities in the United States (New Jersey) and China (Shanghai, Suzhou, Nanjing, and Nantong), 1,300+ scientists, and over fifteen years of experience in Investigational New Drug (IND) application, our DMPK team at WuXi AppTec are serving 1,700+ global clients, and have successfully supported 2,100+ IND applications.
Reference
[1] KEBARLE P, VERKERK U H. Electrospray: From ions in solution to ions in the gas phase, what we know now[J]. Mass Spectrometry Reviews, 2009, 28(6): 898-917.
[2] Vishal Srivastava, Making Molecules Fly: Ionization Methods in Mass Spectrometry, Bitesize Bio, 2025. CC BY 4.0 license.
[3] GATES P J. Atmospheric pressure chemical ionisation mass spectrometry for the routine analysis of low molecular weight analytes[J]. European Journal of Mass Spectrometry, 2021, 27(1): 13-28.
[4] XU X, MEI H, WANG S, et al. A study of common discovery dosing formulation components and their potential for causing time-dependent matrix effects in high-performance liquid chromatography tandem mass spectrometry assays[J]. Rapid Communications in Mass Spectrometry, 2005, 19(18): 2643-2650.
[5] CONSTANTOPOULOS T L, JACKSON G S, ENKE C G. Challenges in achieving a fundamental model for ESI[J]. Analytica Chimica Acta, 2000, 406(1): 37-52.
[6] BONFIGLIO R, KING R C, OLAH T V, et al. The effects of sample preparation methods on the variability of the electrospray ionization response for model drug compounds[J]. Rapid Communications in Mass Spectrometry, 1999, 13(12): 1175-1185.
[7] KING R, BONFIGLIO R, FERNANDEZ-METZLER C, et al. Mechanistic investigation of ionization suppression in electrospray ionization[J]. Journal of the American Society for Mass Spectrometry, 2000, 11(11): 942-950.
[8] AMAD M H, CECH N B, JACKSON G S, et al. Importance of gas-phase proton affinities in determining the electrospray ionization response for analytes and solvents[J]. Journal of Mass Spectrometry, 2000, 35(7): 784-789.
[9] PANUWET P, HUNTER R E, D’SOUZA P E, et al. Biological matrix effects in quantitative tandem mass spectrometry-based analytical methods: Advancing biomonitoring[J]. Critical Reviews in Analytical Chemistry, 2016, 46(2): 93-105.
[10] TONG X S, WANG J, ZHENG S, et al. Effect of signal interference from dosing excipients on pharmacokinetic screening of drug candidates by liquid chromatography/mass spectrometry[J]. Analytical Chemistry, 2002, 74(24): 6305-6313.
[11] CHANG M, LI Y, ANGELES R, et al. Development of methods to monitor ionization modification from dosing vehicles and phospholipids in study samples[J]. Bioanalysis, 2011, 3(15): 1719-1739.





Stay Connected
Keep up with the latest news and insights.

